
Bitcoin
Bitcoin Price Analysis – Three Times A Charm?

After finding its footing last week at the 5700 level, Bitcoin price has since started to exhibit some momentum/mojo and has begun to show some life in the past week of trade. While the overall trend remains lower, which both investors/traders need to be cognizant of such conditions, as well as further work required in order for BTC to right the ship and repair the technical damage inflicted over the past six months, nonetheless, the recent action is a start and certainly welcome for those longer-term HODL’ers.
While Bitcoin Cash (BCH); Ethereum (ETH) and LiteCoin (LTC) continue to struggle with their 20 day moving average and have been unable to overcome the hurdle thus far, BTC has not only managed to recapture its 20 SMA but, has now been capable of four consecutive closes above its 20 SMA and is presently working on its fifth if it can complete the job in today’s session, which from a short-term technical perspective, would be a favorable development.
Furthermore, when observing the daily Chart of BTC below, we can see that it appears that Bitcoin is once again in the process of forming a potential inverted Head-and-Shoulders (H&S) formation. Although additional work is required in the development process, it is something that both investors/traders may want to monitor in the days ahead for further clues.
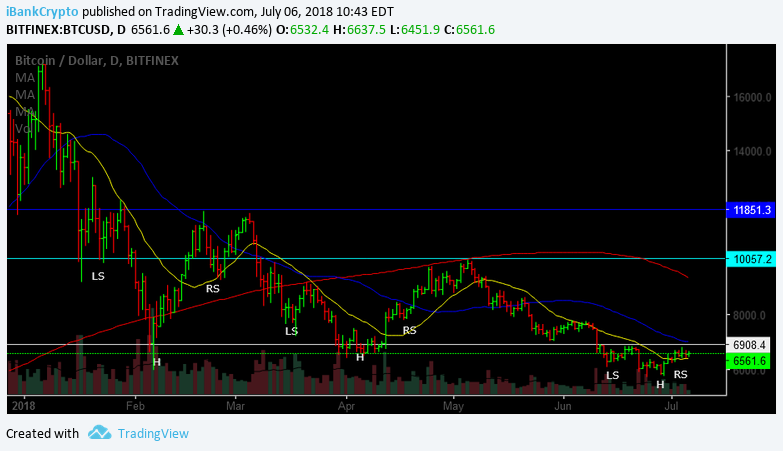
As we can witness from the daily chart above, not only is BTC in the process of yet another potential inverted H&S formation, yet we can also see that on two (2) prior occasions in both 1Q as well as 2Q, where on both attempts at completing the formation, BTC was rejected (dark blue and light blue horizontal lines) and subsequently rode the slippery slope to lower depths.
Thus, will this recent formation for BTC be three times a charm via its completion?
With the jury remaining in deliberations and having yet to deliver its verdict, both investors/traders may want to pay particular attention to the following levels moving forward as a guide as well as providing additional evidence/clues with regards to short-term direction.
If, at any time in the days/weeks ahead, BTC can go ‘top-side’ of the 6900 level and ‘stick’, such development, should it materialize, would likely set the stage for greener pastures with a potential objective from the measured move of 7800-8000 zone.
On the flip-side, the 20 SMA (yellow line), presently located at 6388 as of this writing, provides potential short-term support and perhaps more importantly, the 6190 level. Should 6190 ‘give way’ at any point in the not too distant future, such would likely suggest another failure and void the developing inverted H&S formation currently in progress.
Needless to say, risk management remains priority number one, as always, while we await further cards from the deck to be revealed.
Happy Trading!!
For the latest cryptocurrency news, join our Telegram!
Disclaimer: This article should not be taken as, and is not intended to provide, investment advice. Global Coin Report and/or its affiliates, employees, writers, and subcontractors are cryptocurrency investors and from time to time may or may not have holdings in some of the coins or tokens they cover. Please conduct your own thorough research before investing in any cryptocurrency and read our full disclaimer.
Image courtesy of Pexels
Charts courtesy of tradingview.com


Bitcoin price dumped hard on Monday, briefly slipping below $41,000, erasing gains recorded in the previous week. The premier cryptocurrency seems to have exhausted its recent rally propelled by industry vulnerabilities. At the time of writing, the world’s largest cryptocurrency was trading slightly lower at $41,385. Bitcoin’s total market cap has dipped by 2% over the past day, while the total volume of BTC tokens traded over the same period climbed by 58%.
Fundamentals
Bitcoin price has been facing retracements and a rollercoaster over the past few days after recently rocketing to a 20-month peak. On-chain data has suggested that many investors used the opportunity to take some profits, leading to a decline in the asset’s price.
Bitcoin’s price slump is mirrored in the wider crypto market, with the global crypto market cap decreasing by 1.85% over the past 24 hours to $1.55 trillion. The total crypto market volume has increased by 32% over the same period. The Crypto Fear and Greed Index has plunged from a level of extreme greed to a greed level of 70, suggesting a decline in risk appetite.
Ethereum, the largest altcoin by market capitalization, is currently trading at $2,167, down almost 3% for the day. Meme coins have been hit hard by the market slump, with Dogecoin and Shiba Inu down by more than 4% over the last day.
Last week on Thursday, cryptocurrency experts took notice of…

Bitcoin price edged lower on Thursday despite optimism in wider markets on the back of the Fed’s interest rate decision. The flagship cryptocurrency has been consolidating above the critical level of $42,000 after briefly topping $44,000, its highest level in 20 months. Bitcoin was trading 0.71% lower at $42,569 at press time. BTC’s total market cap has increased by more than 3% over the last day to $832 billion, while the total volume of the asset traded over the same period jumped by 22%.
Economic Outlook
Bitcoin price has been trading sideways over the past few days, suggesting a pause in its recent rally towards $45,000. The premier cryptocurrency has decreased by 4% in the past week but remains 15.22% higher in the month to date. The digital asset has staged a significant recovery this year after a torrid 2022 in which a string of scandals, including the collapse of FTX, led to a market meltdown, undermining the credibility of the sector.
The crypto market has been buoyed by the Fed’s latest interest rate decision. The US Federal Reserve on Wednesday held its key interest rate unchanged for the third consecutive time, in line with market expectations. With the easing of the inflation rate, members of the Federal Open Market Committee (FOMC) voted to keep the benchmark overnight borrowing rate in a targeted range between 5.25%-5.5%.
Additionally, the central bank indicated that three rate…

Bitcoin price has been hovering above the $43,000 psychological level over the past two days amid anticipation about the potential approval of a spot bitcoin ETF. The flagship cryptocurrency has climbed more than 16% in the past week and nearly 170% in the year to date. Bitcoin’s total market cap has increased by nearly 5% over the past 24 hours to $858.9 billion, while the total volume of the token traded rose by 43%. The Bitcoin price was trading at $43,914 at press time.
Fundamentals
Bitcoin price has posted significant gains over the past few days, climbing to its highest level since April 2022, before the crash of a stablecoin that started a litany of company failures, pummeling crypto prices. The world’s largest cryptocurrency briefly topped the crucial level of $44,000 on Wednesday amid rising momentum despite being massively overbought.
According to analysts, with no spot bitcoin ETF approvals yet and the halving event five to six months away, the market is riding on FOMO. Capital has been flowing in the Bitcoin market amid enthusiasm that the launches of spot ETF will bring in billions of dollars of new investment into the crypto sector.
Investors have already started providing capital as seed money for ETF products. Notably, a recent report by CoinDesk showed that the world’s largest fund manager, BlackRock, received $100,000 in capital from a seed investor for its spot bitcoin exchange-traded fund…


-
 Blogs6 years ago
Bitcoin Cash (BCH) and Ripple (XRP) Headed to Expansion with Revolut
-
 Blogs6 years ago
Another Bank Joins Ripple! The first ever bank in Oman to be a part of RippleNet
-
 Blogs6 years ago
Standard Chartered Plans on Extending the Use of Ripple (XRP) Network
-
 Blogs6 years ago
Electroneum (ETN) New Mining App Set For Mass Adoption
-
 Don't Miss6 years ago
Ripple’s five new partnerships are mouthwatering
-
 Blogs6 years ago
Ethereum Classic (ETC) Is Aiming To Align With Ethereum (ETH)
-
 Blogs6 years ago
Cryptocurrency is paving new avenues for content creators to explore
-
 Blogs6 years ago
Litecoin (LTC) Becomes Compatible with Blocknet while Getting Listed on Gemini Exchange


