Bitcoin
Bitcoin Cash (BCH) Technical Analysis – Nothing Good Happens Below The 200 Day Moving Average

After bottoming out in early April at the 600 level, Bitcoin Cash (BCH) put in a spectacular run for the roses appreciating three-fold topping out earlier this month at 1849. Yet has since found the going challenging and once again trading below its 20 (yellow line) and 200 (red line) day moving averages, while BCH attempts to hold the line at its 50DMA (blue line) as we can witness in the Chart below:
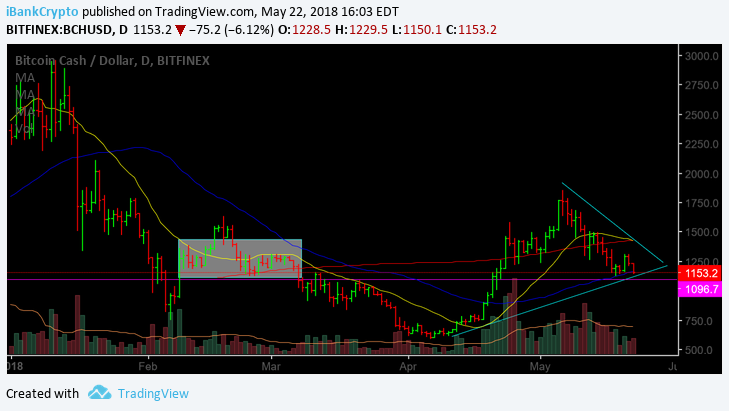
As we can observe from the daily chart above, BCH finds itself trading beneath its 20 and 200DMA’s and attempting to maintain its 50DMA. In addition, we can also see that BCH presently resides in a former congestion zone from the February through early March time-frame within the shaded area acting as potential support.
While BCH has yet to violate short-term support located at the 1128 level, when weighing all of the evidence taking place, such as trading below both its 20 and 200DMA’s as well as the overall market climate, the likelihood of BCH breaching its 50DMA and testing the 1128 figure remains a viable possibility and probability particularly with cryptocurrency conditions as slippery as they are at present.
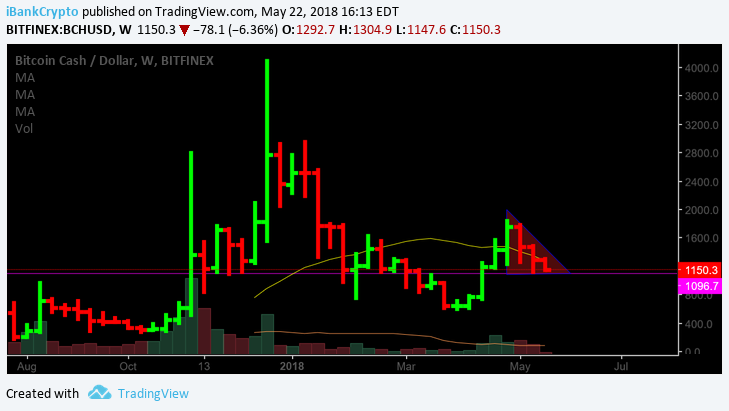
When zooming-out to the Weekly Chart above, we can also observe that BCH is trading within a triangle formation and perhaps more importantly, just how critical the 1128 potential support level is as it dates back to the week of 11/20/17.
Taking all of the above into consideration, both the action on the daily and weekly time-frames (charts), both investors and traders alike may want to pay close attention to the action in BCH moving forward.
With that said, let’s take a closer look at specific levels that may provide further clues/evidence in order to ascertain which direction BCH may have in store in the forthcoming days/weeks ahead.
If, at any time in the days ahead BCH is unable to hold its 50DMA, which as of this writing, finds itself ticking slightly below, the probability of a test at the aforementioned potential support level of 1128 would certainly come into ‘play’.
Should the 1128 level ‘give way’ at any time in the days/weeks ahead, such development, should it materialize, would be extremely concerning as that would likely set the stage for a possible move into Tier II support, which can be found at the 950-1000 zone.
However, should BCH be capable of holding both its 50DMA (1162) and staving off a test of the 1128 level as well and can turn the tides north, a move that clears the 1313 and perhaps more importantly, the 1357 figure, would surely be an encouraging step from a short-term perspective, in righting the ship.
Nevertheless, BCH presently finds itself, as do many in the cryptocurrency universe, at a key inflection point attempting to stem the bleed lower. As the saying goes, “Nothing good happens below the 200-day moving average”, and that’s precisely where we find numerous names presently residing.
Happy Trading!!
For the latest cryptocurrency news, join our Telegram!
Disclaimer: This article should not be taken as, and is not intended to provide, investment advice. Global Coin Report and/or its affiliates, employees, writers, and subcontractors are cryptocurrency investors and from time to time may or may not have holdings in some of the coins or tokens they cover. Please conduct your own thorough research before investing in any cryptocurrency and read our full disclaimer.
Image courtesy of Pexels
Charts courtesy of tradingview.com