Bitcoin
Bitcoin Price Blasts $44K in Spectacular Surge as Spot Bitcoin ETF Approval Looms Large

Bitcoin price has been hovering above the $43,000 psychological level over the past two days amid anticipation about the potential approval of a spot bitcoin ETF. The flagship cryptocurrency has climbed more than 16% in the past week and nearly 170% in the year to date. Bitcoin’s total market cap has increased by nearly 5% over the past 24 hours to $858.9 billion, while the total volume of the token traded rose by 43%. The Bitcoin price was trading at $43,914 at press time.
Fundamentals
Bitcoin price has posted significant gains over the past few days, climbing to its highest level since April 2022, before the crash of a stablecoin that started a litany of company failures, pummeling crypto prices. The world’s largest cryptocurrency briefly topped the crucial level of $44,000 on Wednesday amid rising momentum despite being massively overbought.
According to analysts, with no spot bitcoin ETF approvals yet and the halving event five to six months away, the market is riding on FOMO. Capital has been flowing in the Bitcoin market amid enthusiasm that the launches of spot ETF will bring in billions of dollars of new investment into the crypto sector.
Investors have already started providing capital as seed money for ETF products. Notably, a recent report by CoinDesk showed that the world’s largest fund manager, BlackRock, received $100,000 in capital from a seed investor for its spot bitcoin exchange-traded fund (ETF). The prestigious Wall Street firm applied to the SEC in June to release its spot bitcoin ETF, which has been pending approval.
The growing excitement around Bitcoin’s halving event scheduled for May 2024 has also buoyed the Bitcoin price. Halving is an event that occurs every four years where miners see the rewards for their work cut in half, keeping a cap on the supply of Bitcoin. The halving event is often a factor behind a new rally.
Bitcoin Price Outlook
The daily chart shows that the Bitcoin price has been on a tear over the past few days, characterized by a bullish channel shown in yellow. Technical indicators suggest a continuous bull run in the immediate term. The premier cryptocurrency remains above the 50-day and 200-day exponential moving averages and the 100-day and 200-day simple moving averages.
Its Relative Strength Index (RSI) is in the overbought territory at 80, indicating an increase in buying pressure. The Moving Average Convergence Divergence (MACD) indicator also notes growing green bars, suggesting a bullish outlook.
As such, the Bitcoin price will likely continue to edge higher as bulls target the next critical resistance at $45,000. A breach above this level would clear the path for a home run to the psychological level of $50,000.
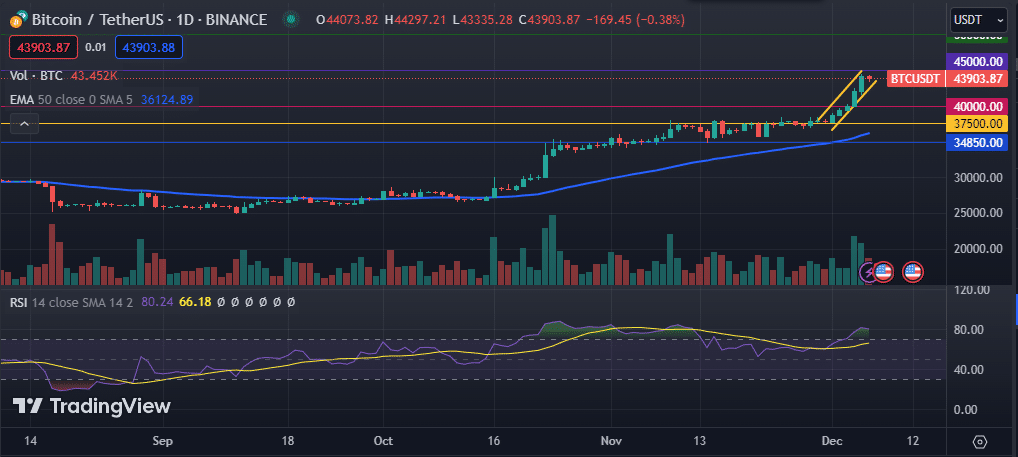
BTC Price Chart