Bitcoin
Bitcoin Price is Plummeting: Bulls Need to Clear $28,000 for More Upside

Bitcoin price has been in the red for four consecutive days, starting a fresh decline below the $27,500 support level. At the time of writing, Bitcoin had lost 1.39% to trade at $26,832.20. The cryptocurrency market leader has lost more than 7% in the past four days but remains 62% higher in the year to date. Its total market cap has slipped to $520 billion over the past 24 hours, with the asset’s total volume falling further.
Fundamentals
Bitcoin price has been in a freefall for the past few weeks, ending the month of May more than 8% lower, capping its first down month since the start of the year. Bitcoin experienced its worst month in May since November 2022 as optimism around the US debt ceiling rally melted away. Ethereum, the second-largest cryptocurrency by market cap, also fell more than 2% in May, its worst month since December 2022.
The cryptocurrency market has been moving in tandem with major stock averages, which closed lower on Wednesday as investors shifted their focus to the House vote on the US debt ceiling deal. A divided US House of Representatives passed a bill to suspend the US debt ceiling deal to 2025 as agreed by US President Joe Biden and House Speaker Kevin McCarthy.
Focus is now on the Democratic-led Senate as investors closely watch to see how the bill will fare. With only a few days left before the federal government enters a default, running out of money to pay its bills, investors seem to be in conservation mode.
The US dollar has retreated against most of its major peers as traders trim expectations of the Federal Reserve hiking interest rates further in its June meeting. Even so, the fast-approaching debt ceiling deadline has offered the greenback safe-haven support.
Bitcoin Price Analysis
Bitcoin price has failed to start a fresh upside trajectory above the key resistance level of $28,000. The asset has slipped below the key support zone at $27,500 and currently hovers around the crucial support level of $26,500. The coin is moving below the bearish trend line shown in yellow.
On the daily chart, Bitcoin price is moving below and above the 50-day and 200-day exponential moving averages, respectively. It is also moving below the 50-day and 100-day simple moving averages. Its Relative Strength Index (RSI) is moving slightly below the signal line.
Therefore, the next resistance level for the Bitcoin price is at the 50-day EMA at $27,404. An upside trend above this level might push the price higher to $28,000. Conversely, if the Bitcoin price fails to meet the aforementioned resistance level, it will move lower to the immediate support level of $26,500.
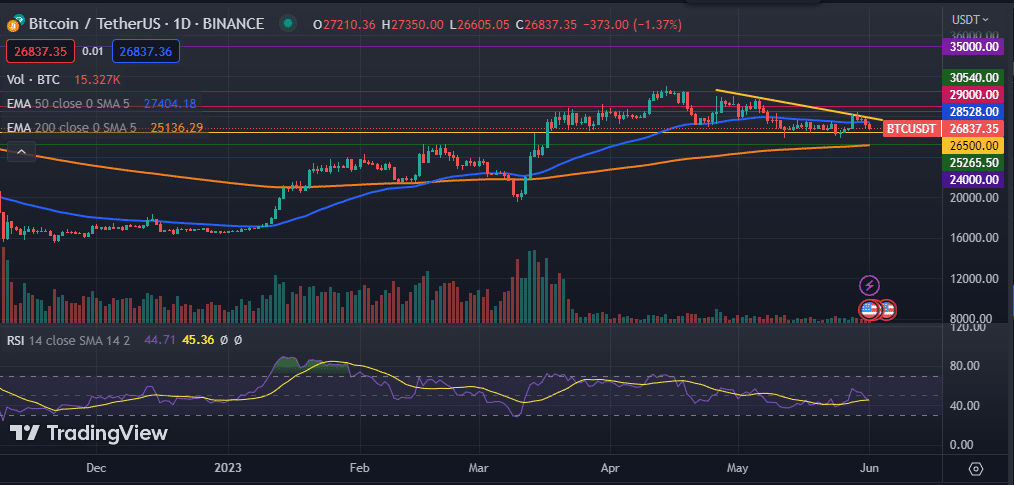
BTC Price Chart