Bitcoin
Bitcoin Price Plummets Under $27,000 Despite Standard Chartered’s Upbeat Forecast

Bitcoin price has been hovering below the crucial level of $27,500 over the past 24 hours amid poor crypto market conditions. The premier cryptocurrency has slumped by nearly 2% in the past week, with its total market cap down by 2.25% over the last day. At press time, the digital currency was trading 2.45% lower at $26,720.
Crypto Market Turmoil
Crypto prices have been on a bearish trajectory over the past few days, with Bitcoin, the largest cryptocurrency by market cap, dipping for four consecutive days. The global crypto market cap has continued to decline over the period and is currently at $1.06 trillion, while the total crypto market volume increased by nearly 3% over the past 24 hours. Bitcoin’s dominance has also decreased slightly over the same period.
The Crypto Fear and Greed Index, which is a key measure of the market sentiment of the participants, is at a fear level of 42, slightly lower than the fear level of 45 recorded on Monday. The index uses several metrics, including volatility, market momentum, volume, and worldwide news. Readings close to 0 indicate extreme fear, implying that investors in the market are selling irrationally. Even so, fear levels tend to present buying opportunities.
Bitcoin price has been struggling to hold above the psychological level of $27,500 for the past few days, weakening the overall crypto market sentiment. Altcoins, including Ethereum, XRP, Solana, Cardano, Dogecoin, and Polygon, among others, have also been on a downward trajectory in tandem with Bitcoin’s cascading effect.
Despite its near-term bearish outlook, analysts from Standard Chartered seem optimistic about Bitcoin’s future. Forecasts published by Standard Chartered on Wednesday suggest that Bitcoin could experience a significant price increase in the ensuing years. While the bank had predicted a $100,000 valuation for Bitcoin by the end of 2024, recent insights by their top FX analyst, Geoff Kendrick, indicate a 20% climb to that figure. Even so, caution is advised, seeing that Bitcoin has a history of speculative valuations.
Bitcoin Price Analysis
The daily chart shows that the Bitcoin price has been moving lower and showing bearish signs. The digital asset failed to gain pace above the resistance level of $28,145. The leading cryptocurrency has been experiencing fluctuations over the past 24 hours, seeing its price oscillate between an intraday high of $27,477 and a low of $26,721.
The cryptocurrency remains below the 50-day and 200-day exponential moving averages, as well as the 100-day and 200-day simple moving averages. Its RSI has dropped below the signal line and the neutral level to 45, suggesting an increase in selling pressure.
Therefore, the Bitcoin price needs to break above the important level of $26,900 for an increase to the major hurdle of $27,500. Enough momentum by bulls could push the price above the aforementioned level, prompting subsequent gains above the resistance at $28,145. Conversely, a drop below the immediate support level of $26,500 might pave the way for further losses to $26,000.
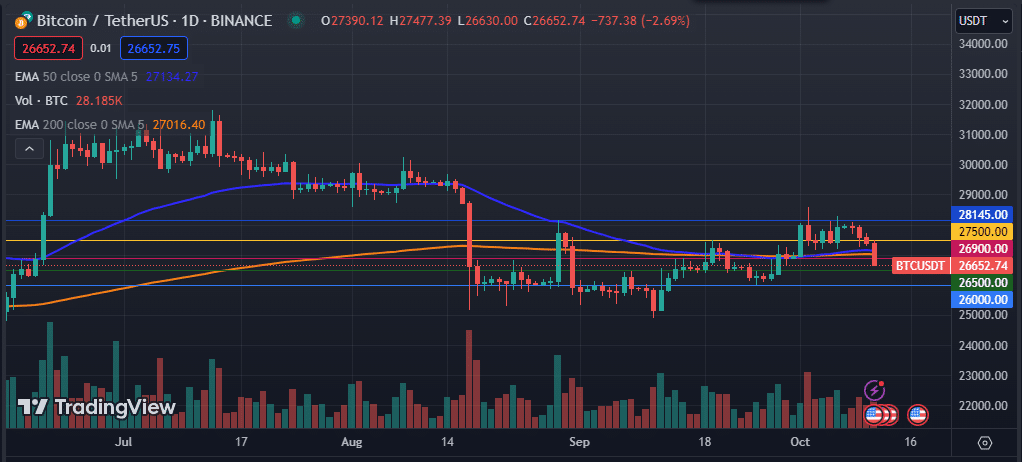
BTC Price Chart