Featured news
Cronos Price Forms Bearish Divergence as Cryptos Rebounds

Cronos price has been in a strong recovery in the past few weeks as cryptocurrencies rebound. CRO rose to a high of $0.066, the highest point since December 10. It has soared by more than 18% from the lowest point in 2022. So, what next for the token?
What is Cronos?
Cronos is a blockchain project that was developed by Crypto.com, one of the biggest crypto exchanges in the world. It was previously known as Crypto.com Chain until it rebranded in November 2021.
Cronos is a smart contract platform that aims to be a better alternative to Ethereum and other networks like Solana and Avalanche. It is also an Ethereum Virtual Machine (EVM), meaning that apps developed in its ecosystem are compatible with Ethereum.
Cronos has been used to build all types of dApps, including Decentralised Finance (DeFi), Non-Fungible Tokens (NFT), and the metaverse. Some of the most notable DeFi apps in its ecosystem are Tectonic, VVS Finance, Ferro, and MM Finance among others.
The metaverse platforms in the ecosystem are Metaverse Pixels, Cronos Ragdolls, Pampered Pandas, and Crowboys. It has also been used to build NFT collections like Cronos Chimp Club, Crosmonauts, Crocus NFT, and Agora among others.
CRO price crashed in 2022 as other cryptocurrencies plunged. This decline happened as the Fed increased interest rates. The bank hiked interest rates by 450 basis points as inflation rose.
It also crashed as its ecosystem imploded. The total value locked (TVL) in the ecosystem crashed from more than $4 billion to about $375 million. This decline was in line with other blockchains. Ethereum’s TVL plunged from over $150 billion to about $35 billion. The BNB Chain saw its TVL crash from over $35 billion to about $5 billion.
Cronos price prediction
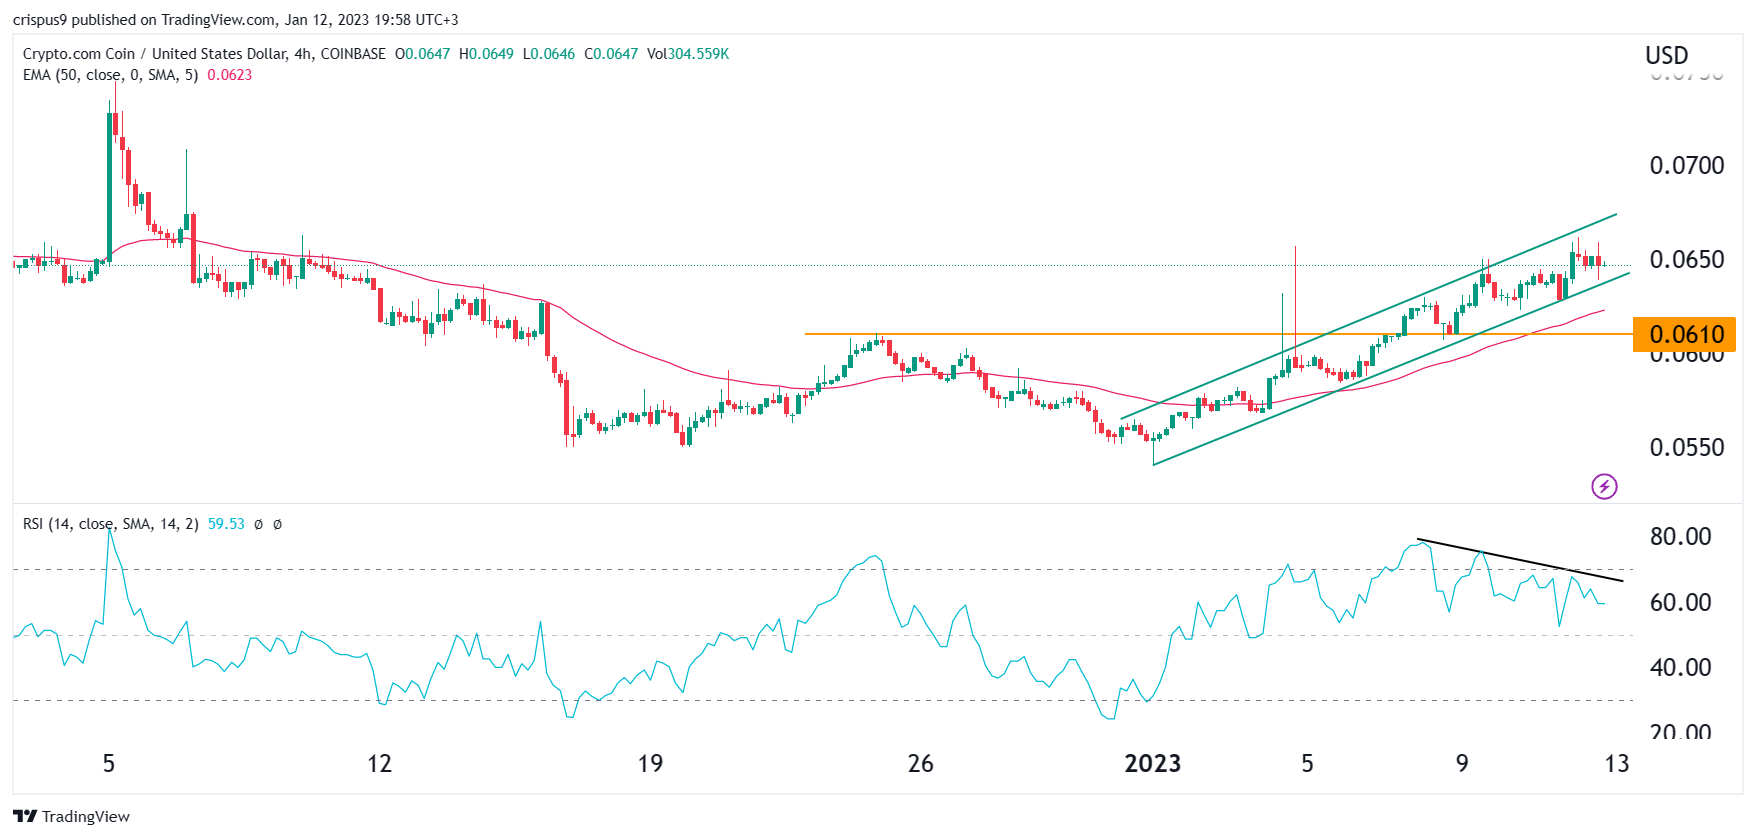
The four-hour chart shows that the CRO price has been in a strong bullish trend in the past few days. As it rose, it has formed an ascending channel pattern that is shown in green. It has also moved above the 25-day and 50-day moving averages. The Relative Strength Index (RSI) has formed a bearish divergence pattern.
Therefore, the token will likely continue falling as sellers target the key support level at $0.60. A move above the resistance point at $0.065 will invalidate the bearish view.