Altcoins
Ethereum Price Dips as Markets Digest Latest Fed’s Interest Rate Decision

Ethereum price has been hovering around its highest level in 7 months for the past few days amid a boost in the crypto market. ETH has jumped more than 49% in its year-to-date price, increasing 5% in the past week. Ethereum’s total market cap has slipped by more than 3% over the last day, while the total volume of the altcoin traded increased by more than 6%.
Fundamentals
Just like most cryptocurrencies, Ethereum price found support in the recent fiasco in the banking sector. The recent vulnerability in the banking sector pumped liquidity in the global crypto market as investors shifted to other assets such as cryptocurrencies. Bitcoin, the largest cryptocurrency by market cap, saw its price hit its highest level in 9 months, while Ethereum jumped to a 7-month high.
The global crypto market was in the red later on Wednesday as investors chewed on the Fed’s latest interest rate decision. The Federal Open Market Committee (FOMC) announced on Wednesday a 25-basis point hike in the federal funds to 5%, down from 4.75%.
According to a statement by the US Federal Reserve, the FOMC remains highly attentive to inflation risks as it seeks to achieve an inflation rate of 2%in the long run. The Committee also announced that it anticipates additional policy firming to help in attaining a stance of monetary policy to aid in achieving the 2% target.
According to the Fed’s median forecast, the Federal Reserve will hike interest rates one more time in 2023 before ending its inflation fight. The Fed kept its terminal rate unchanged in the target range of 5%-5.25%.
Ethereum Price Analysis
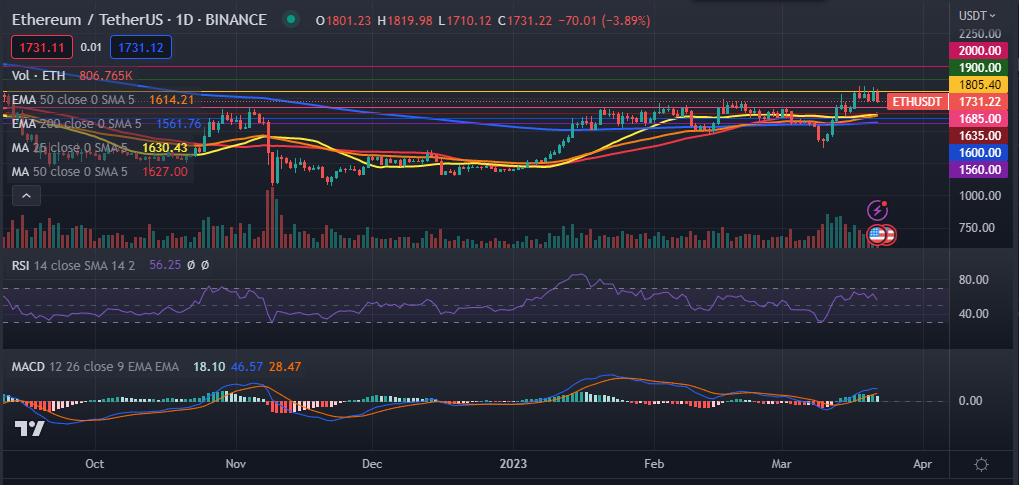
Ethereum price tumbled on Wednesday as markets digested the Fed’s latest decision. At press time, the largest altcoin by market cap was trading 4.35% lower at $1,722.92. The ETH price hit an intraday high of $1,819.98 before pulling back. Even so, Ethereum continues to trade above the 25-day and 50-day moving averages. It is also trading above the 50-day and 200-day exponential moving averages.
Its Relative Strength Index (RSI) has inched lower to 55, hinting at a decline in buying pressure. The Moving Average Convergence Divergence (MACD) indicator shows a decline in bullish momentum.
Therefore, the Ethereum price is likely to face a short-lived decline in the short term as bears eye the next logical support levels at $1,685 and $1,635 along the 25-day and 50-day MA. On the other hand, a move past the resistance level at $1,805.40 will invalidate the cautiously bearish thesis.