Altcoins
Litecoin Price Outlook Amid Bearish On-Chain Metrics

Litecoin price has been under intense pressure over the past weeks, hovering around its lowest level this year on the back of poor on-chain metrics and a dull market. The LTC price has dipped by 5.55% in the past week and 33% in the past three months. Additionally, the asset has crashed by 12% in the year to date but remains 22% higher in the past year. Litecoin has a total market capitalization of $4.5 billion, ranking it 15th after Polkadot.
What’s Happening with LTC?
Litecoin price has been on a strong bearish trajectory since its successful third halving event completed in early August. The digital asset has fallen off crypto investors’ radar since then mainly due to the price dip it experienced after heavy profit-taking from investors who had invested in Litecoin leading up to the price surge triggered by market expectations around the halving event.
On-chain data shows that the daily transaction numbers for Litecoin have been on a consistent decline since the halving event in August. According to BitInfoCharts, the number of daily LTC transactions has decreased from over 584,000 in May to 104,000 transactions in October. This suggests the lack of interest from investors, prompting a decline in risk appetite.
Litecoin, the silver to Bitcoin’s gold, has always had a high correlation with Bitcoin, making it vulnerable to volatility in the lead cryptocurrency. Beyond its correlation with Bitcoin and broader market cues, the altcoin is vulnerable to a price decline owing to the inactivity of its whale addresses. Despite the whale addresses controlling about 11% of the entire circulating supply, their buying and selling activity triggers the market.
Even so, data from Coinmarketcap shows an improvement in the asset’s daily transaction volumes. At the time of writing, the total volume of LTC traded in the past 24 hours climbed by nearly 14%, pointing to the possibility of a price reversal.
Litecoin Price Technical Analysis
The daily chart shows that the Litecoin price has been range-bound for the past few days, trading between the tight range of $61 and $65. The altcoin has dropped by more than 45% from its highest level since this year of $114 seen in July. Litecoin has failed to recover above the important level of $72.65 since the halving event.
LTC remains below the 50-day and 200-day exponential moving averages, as well as the 50-day and 100-day simple moving averages. Its Relative Strength Index has dropped below the signal line, suggesting an increase in selling pressure. The Moving Average Convergence Divergence (MACD) indicator is signaling a ‘strong sell’.
As such, the Litecoin price is likely to continue falling in the ensuing sessions as bears eye the immediate and crucial support level at $60. A drop below this level could push the price lower to this year’s low of $56. On the other hand, a breach above the 50-day EMA at $65.90 could initiate a price reversal, leading to subsequent gains to $72.65 and $84.
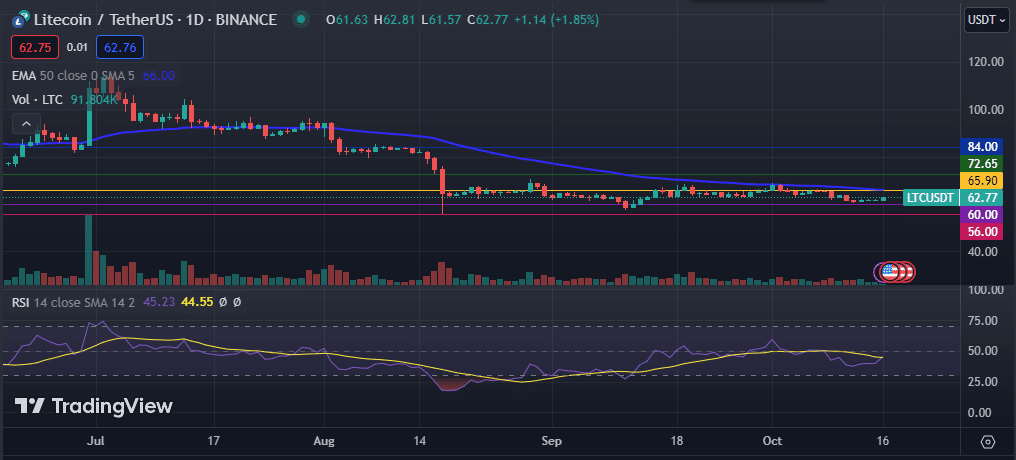
LTC Price Chart