Bitcoin
This One Chart Will Change The Way You Look At The Recent Bitcoin Crash

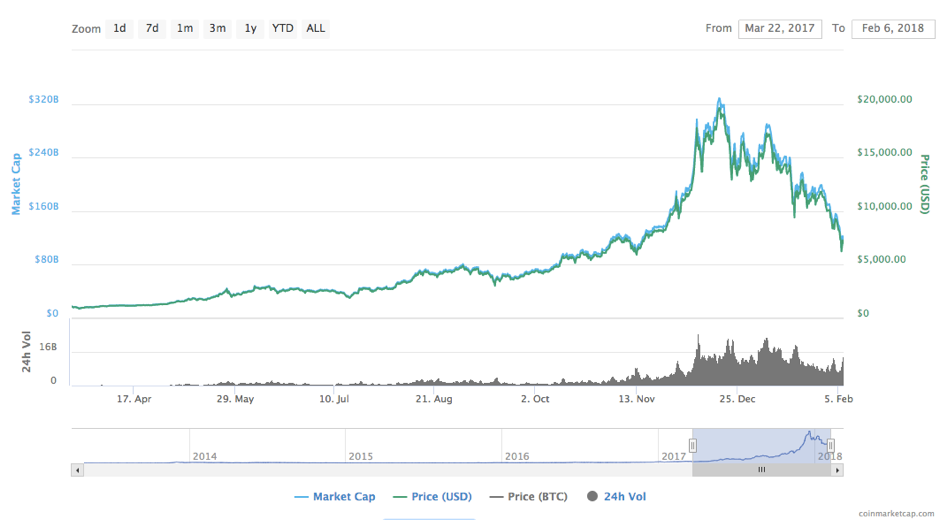
The cryptocurrency space has taken a beating over the last few weeks. Bitcoin (BTC) is down 65% on highs. Ethereum (ETH) is down just shy of 50% across pretty much the same period. If you factor in the pre-South Korean removal prices from CoinMarketCap, Ripple (XRP) is trading at a more than 80% discount to its early January highs.
But here’s the thing: this is a severe correction, sure, but it’s far from the bubble bursting that many are calling.
What’s important to recognize is that those people that have lost money (the only people that have lost money) are those that entered the markets over the last eight weeks or so. Everyone else in the markets have made money.
In other words, it’s only the newer entrants that are sitting on net losses.
Interestingly, it’s the same people that have been hyping this market and that now are claiming its crashing and burning.
CNBC, Bloomberg, etc., were at the forefront of those outlets pushing people to jump into the markets and buy bitcoin, or Ripple, or whatever, as prices ran up in December. And now, it’s these outlets that are fielding so called experts claiming crypto has had its time.
So how does anyone holding bitcoin or other coins deal with the current crash?
Well, take a look at the chart below.
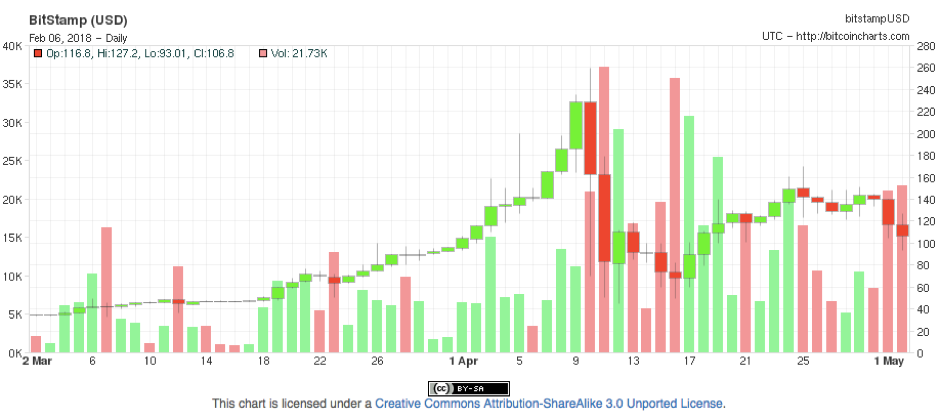
Look familiar? Probably not – it’s the first real collapse we ever saw in the bitcoin price and it happened back in April 2013.
At the time, the price ran up to $260 and then collapsed to a little over $40 within a few days.
But here’s the interesting thing. This period (the end of the third quarter, 2013) coincided with the first time bitcoin started to attract any sort of mainstream media attention. The attention pushed price up as a wave of speculative new money entered the market.
The wave of extra attention pushed the price up and up until it hit an inflection point, the price started to fall and all of the media outlets that caused the run by touting bitcoin to new buyers changed their opinion, called for the death of bitcoin and created a crash.
So, we’ll ask again – sound familiar?
The only difference this time around is that we’re talking about tens of thousands of dollars as opposed to hundreds of dollars in valuation.
The key thing to recognize here is that whatever anyone says, this is far from unprecedented in the bitcoin space and – indeed – it’s something that we’ve seen happen almost to the note, on a number of occasions in the past.
Last time around (so, going back to April 2013), markets took around 7 months to recover. Exactly how long the recovery is going to take this time around is anyone’s guess – it could be longer, because we’re talking about higher per-coin pricing, or it could be shorter based on the dramatically increased daily volume and external interest in the space that exists right now as compares to April 2013 – but that things will recovery is far from a guess.
There are only two sensible things to do at current prices, then.
First, delete Blockfolio (or at least stop checking it every few hours) and ride out the dip. Let the panic sellers exit at the wrong time, do nothing and wait for the price to turn around.
Second, buy buy buy.
We will be updating our subscribers as soon as we know more. For the latest on BTC, sign up below!
Disclaimer: This article should not be taken as, and is not intended to provide, investment advice. Global Coin Report and/or its affiliates, employees, writers, and subcontractors are cryptocurrency investors and from time to time may or may not have holdings in some of the coins or tokens they cover. Please conduct your own thorough research before investing in any cryptocurrency.