Altcoins
Polygon Price Dips Further: Is Another 10% Drop Imminent?

Polygon price has been in a freefall for the past few days, dropping below the crucial support level of $0.95. The altcoin has dipped nearly 9% over the past week and 13% in the past four days. The asset is up by 15.20% in the year to date. Polygon’s market cap has crashed to $8 billion over the past few days, while its total volume fell further. The asset currently ranks as the 10th largest cryptocurrency by market cap, after Solana and ahead of Polkadot.
Fundamentals
Polygon price has been under immense pressure for the past few weeks, dipping more than 43% from its highest level this year in February. At press time, the asset was trading 2.91% lower at $0.8750. The asset’s selloff has been intricately linked to the recent dip in the global crypto market cap.
Data by Coinmarketcap shows that the global crypto market cap has crashed to $1.14 trillion over the past few days, while the total crypto market volume decreased by 27.86% over the last day. Bitcoin’s recent dip below the crucial support level of $28,000, has also seen the MATIC price plunge. Bitcoin, the largest digital asset by market cap, has been changing hands at $27,500 over the past few days amid congestion on the asset’s network.
Binance, the largest cryptocurrency exchange, recently halted the withdrawals of the BTC token temporarily due to congestion on the blockchain. The congestion also resulted in a surge in transaction fees, the highest since 2017. These events saw the Bitcoin price plummet by more than 8% in the past few days.
Investors will be closely watching the US consumer price index data for April, as well as the producer price index data, to gauge the economic outlook. The US Federal Reserve increased its interest rate by 25 basis points earlier last week, a move that did not largely affect the crypto market as investors had already priced in the interest rate hike. Even so, the Fed announced that it was committed to achieving its 2% goal.
Polygon Price Outlook
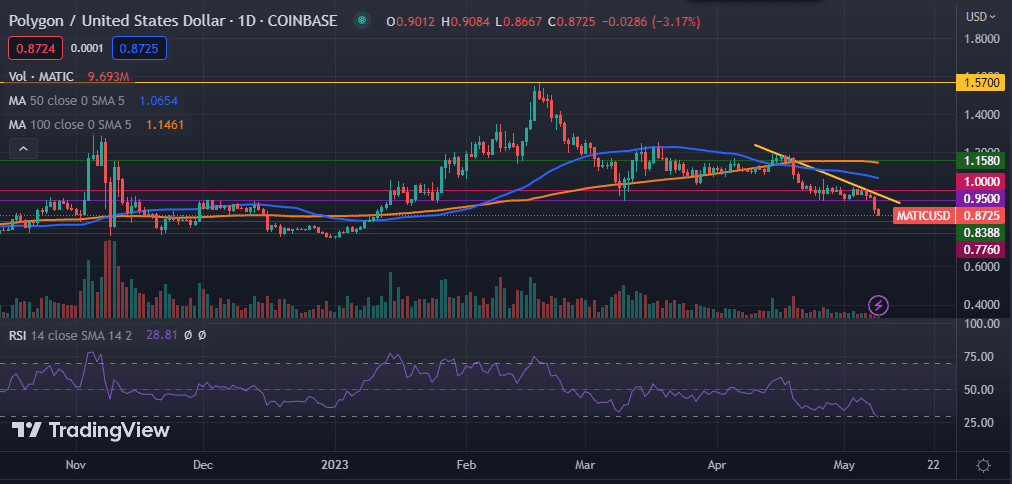
Polygon price has been in a correction phase for the past two months, falling more than 40% from this year’s high of $1.57. As highlighted on the daily chart, the asset has remained below the 50-day and 100-day moving averages, as well as the 50-day and 200-day exponential moving averages. It has also moved below the 50-day and 100-day simple moving averages.
Its Relative Strength Index (RSI) has moved lower into the oversold region, suggesting a prolonged selloff in the ensuing sessions. The Moving Average Convergence Divergence (MACD) indicator is also bearish.
Therefore, I expect the Polygon price to fall further as bears eye the next support levels at $0.8338 and $0.7760. However, a move past the important level of $0.95 might create a new opportunity for the bulls.