Altcoins
Solana Price: Technicals Point to a Sell

Solana price joined in on the recent rally in the global cryptocurrency market, jumping nearly 17% in the past week. Solana has made substantial gains this year, climbing 102% in its year-to-date price. SOL ranks as the 11th largest cryptocurrency after Binance USD and ahead of Polkadot. Despite the altcoin’s recent rally, the total volume of the coin traded has continued to dwindle.
Fundamentals
Solana price was trading slightly higher on Friday as Bitcoin and other altcoins extended their rally despite the bank contagion fears weighing on the markets. Bitcoin and Ethereum have been leading the recent rally in the market, jumping more than 30% and 20% in the past week, respectively.
Investors have welcomed the resilient crypto prices amid the recent crisis in the banking sector this week. The week started with the collapse of Signature Bank and Silicon Valley Bank on Sunday until the focus shifted to Credit Suisse and First Republic Bank. Traders have been digesting the fate of Credit Suisse even after the bank said that it would borrow up to 50 billion Swiss Francs from the Swiss National Bank.
Several analysts have linked the recent rally in the crypto market to lingering bank worries. Even so, crypto prices are heavily influenced by inflation and the Federal Reserve interest rate hikes. According to analysts, the recent decline in banking stocks points to the vulnerability of traditional institutions, raising liquidity concerns in the market. As such, many investors have shifted to digital assets, fueling the buying pressure.
Focus has now shifted to the Federal Reserve’s policy meeting next week. The latest CPI reading was in line with consensus estimates by analysts, fueling hope for a smaller interest rate hike by the Fed. Higher interest rates tend to create a volatile environment for risky assets such as cryptocurrencies.
Solana Price Outlook
Solana price has been bullish for the past few days, but buyer momentum remains insufficient to sustain its recent rally. On the 4-hour chart, SOL is trading below and above the 25-day and 50-day moving averages, respectively. It has managed to remain slightly above the 25-day and 50-day exponential moving averages (EMAs).
Its Relative Strength Index (RSI) is in the neutral zone, pointing to insufficient buying pressure to push the SOL price higher. The Moving Average Convergence Divergence (MACD) indicator is in the bearish zone.
Therefore, SOL’s current rally is likely to be short-lived as bulls struggle to sustain the recent bullish momentum. A move past the key support level at $17.50 might pull the price lower to find support at $15. On the flip side, a break above the important resistance of $22.20 will invalidate the bearish thesis.
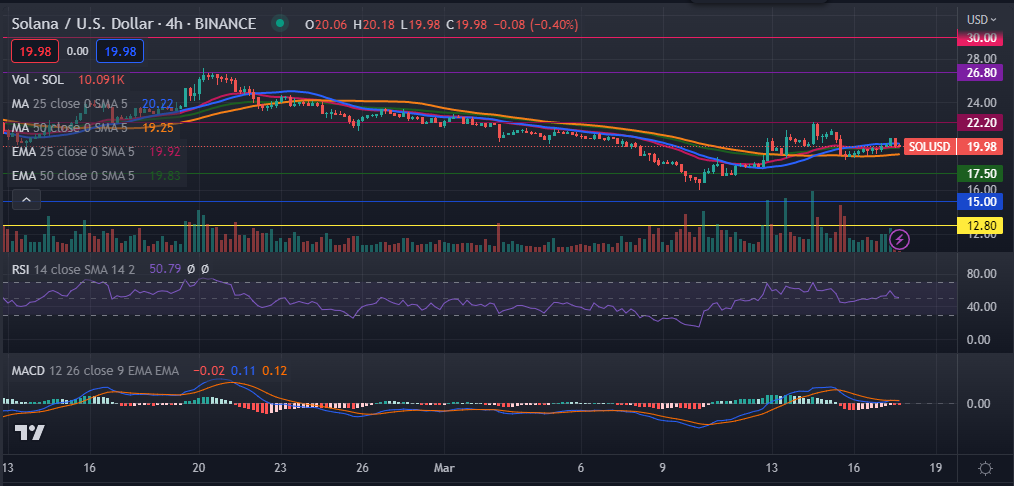
SOL Price Chart