Blogs
Litecoin (LTC) Binance Coin (BNB) Price Analysis – Two Very Different Pictures

While the cryptocurrency complex remains dominated by Bitcoin, and while the popular view continues to be dominated by a cognitive association with the concept of widespread correlation among major cryptocurrency trading vehicles, the fact of the matter is that we do see clear and tangible technical differentiation among a number of highly liquid cryptocurrencies.
Today, we will focus on two coins that have been on very different trajectories over the past four months.
While this also serves to prove a point – that the crypto complex represents far more than just Bitcoin and Ethereum, and their respective gravitational effects – it also provides us with an opportunity to examine in closer detail two very different charts that are frankly both quite interesting at present: Litecoin (LTC) and Binance Coin (BNB).
Litecoin (LTC)
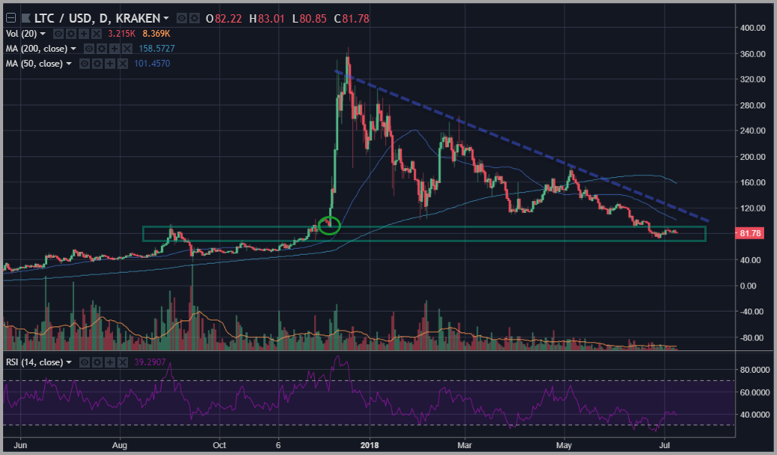
Chart courtesy of tradingview.com
Litecoin (LTC) has just completed what technicians often call a “round-trip”, in that the coin just overshot on the downside taking out the stop orders for those traders and investors hypothetically involved from a cost-basis that immediately preceded the extraordinary spike higher that began on December 8, 2017 at just above the $90 level and culminated on December 19, 2017 at an intraday high just under the $370 level.
LTC closed June with a break back under the $90 level, and a slide that nearly touched support at the $72.50 level.
For technical analysts, this provides something like a sense of closure and the possibility of the establishment of an endpoint to a corrective decline. In a sense, the idea is that the correction must hunt down and kill everyone still hanging onto the idea that the initial breakout was sustainable.
The action last month successfully completed that objective and also sliced under what had been a major advance and the establishment of new all-time highs logged in August and September 2017 just under the $100 level.
In addition, with the break to complete the round-trip and the run of hypothetical stop orders, LTC also printed an RSI score (14-day) under 25. That represents the most extreme oversold reading in the history of this coin’s chart.
This fact underscores the idea that there is a statistical potential – according to the precepts of standard technical analysis – that LTC may well be marking out the lower boundaries of this corrective phase.
This pattern is consistent with an idea that LTC may be starting to flash signals that it could be an excellent “Phase Three Coin” candidate – a term that refers to those coins situated for emerging leadership as the new bull cycle begins to carve out its existence possibly over coming months.
Binance Coin (BNB)
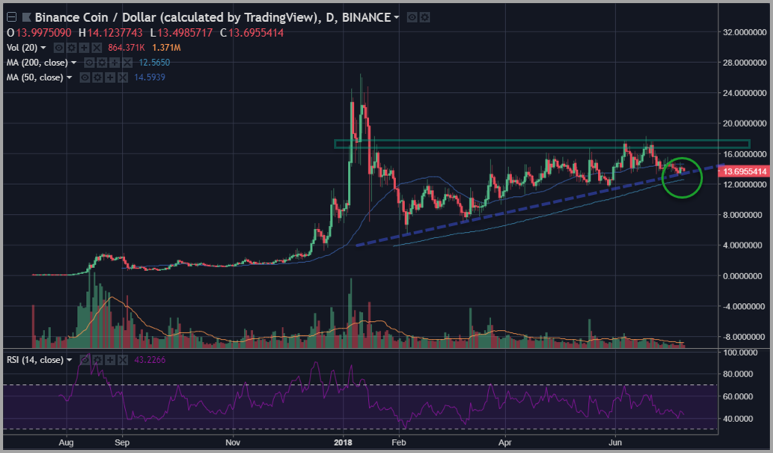
Chart courtesy of tradingview.com
Binance Coin (BNB) provides an exceptional contrast to the concept that all coins trade together. The chart above is a calculation of Binance Coin in US dollar terms. Using a similar standard, most coins that we look at have not managed to remain in an upward trending environment over the past four months. However, as should be clear from the image, BNB has managed to do just that.
Binance Coin has also remained above its 200-day simple moving average for the entirety of 2018. This also stands in stark contrast to the majority of the cryptocurrency complex. This is relative strength, plain and simple.
However, it should be noted that BNB is now testing the trendline defining its upward action since forming the pivot at its year-to-date low on February 5, 2018.
BNB recently checked resistance in late June around the $17.50 level, which roughly matches the closing lows of the interior range that defined the coin’s action in its gyrations near its all-time highs in January of this year.
Where we do see similarities to the rest of the crypto complex is in terms of the distribution of trading volume: we have seen a gradual tapering of average volume over the past four months despite the coin’s grinding upward action during that period.
Given all of these factors, it is imperative that BNB does not now proceed to break underneath both its upward trend line of the last five months and its 200-day simple moving average (ie, a confluence technical breakdown). This would be a sign suggesting Binance Coin could still play catch-up on the downside with the rest of the crypto complex.
However, at this stage, one has to give the benefit of the doubt to BNB just in terms of relative strength and the mechanics of price action displayed on the chart.
Happy Trading!!
For the latest cryptocurrency news, join our Telegram!
Disclaimer: This article should not be taken as, and is not intended to provide, investment advice. Global Coin Report and/or its affiliates, employees, writers, and subcontractors are cryptocurrency investors and from time to time may or may not have holdings in some of the coins or tokens they cover. Please conduct your own thorough research before investing in any cryptocurrency and read our full disclaimer.
Image courtesy of Pexels
Charts courtesy of tradingview.com