Crypto
Litecoin Price Fails at $72.80 Despite Bullish On-Chain Data

Litecoin price has been showing signs of exhaustion after its recent upswing. Litecoin, the silver to Bitcoin’s gold, has dipped by nearly 2% in the past week and remains more than 3% lower in the year to date. The asset’s total market cap has slumped by almost 2% to $5 billion in the past 24 hours, ranking LTC 17th after DAI. At the time of writing, the LTC price was trading 1.61% lower at $67.76.
LTC Outlook
Litecoin price has posted significant losses over the past few months, slipping by more than 23% in the past six months. Last week, the altcoin jumped to its highest level since August on the back of Bitcoin’s rally and broader market sentiment before slightly pulling back.
Despite its downtrend, Litecoin has achieved remarkable milestones over the past month. The digital currency set a record in its network’s hashrate. The Litecoin Foundation took to X (formerly Twitter) to announce the milestone reached. Litecoin has set a new ATH in its network hashrate, an indicator of the overall security of a blockchain network. Mining hashrate is a key security metric since more hashing power in the network signifies greater security and better chances at overall resistance to attacks. The Litecoin hashrate has grown from 1 TH/s in August 2014 to over 750 TH/s in August this year.
Earlier in October, Litecoin celebrated its 12th birthday, marking 12 years of zero downtime. The Litecoin network has recorded 180 million transactions throughout the period, highlighting growth in its usage and an increase in its adoption on the market.
Additionally, data by Santiment revealed a surge in on-chain activity and whale transactions, reaching four-month highs, suggesting increased market interest. As of last week on Wednesday, the number of daily transactions on the network rose to 319,000- its highest level since June this year, suggesting a bullish outlook for LTC despite its price struggles.
Litecoin Price Analysis
Litecoin price has been moving sideways over the past few days, exhibiting signs of exhaustion from its recent rally. The digital currency has failed to start a fresh rally above the crucial level of $72.80. Litecoin remains above and below the 50-day and 200-day exponential moving averages, respectively. Its Moving Average Convergence Divergence (MACD) indicator signals a buy. Its RSI is slightly above the neutral level at 57.
As such, the Litecoin price outlook remains uncertain in the near term as the altcoin struggles to find direction. A breach above the immediate resistance level of $72.80 might pave the way for further gains to $80. However, a failure to break above the level could trigger a breakdown of the RSI’s 50 level, enforcing a bearish outlook.
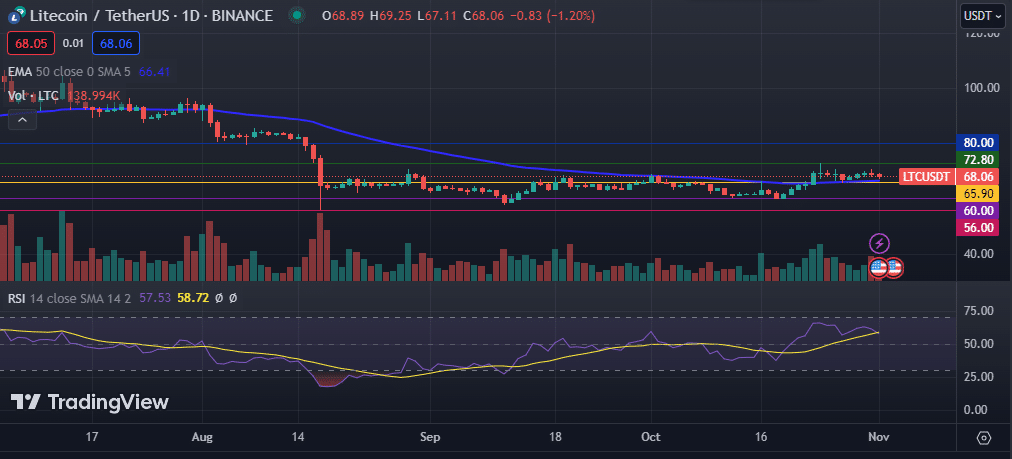
LTC Price Chart