
Crypto
Litecoin Price Fails at $72.80 Despite Bullish On-Chain Data
Litecoin price has been showing signs of exhaustion after its recent upswing. Litecoin, the silver to Bitcoin’s gold, has dipped by nearly 2% in the past week and remains more than 3% lower in the year to date. The asset’s total market cap has slumped by almost 2% to $5 billion in the past 24 hours, ranking LTC 17th after DAI. At the time of writing, the LTC price was trading 1.61% lower at $67.76.
LTC Outlook
Litecoin price has posted significant losses over the past few months, slipping by more than 23% in the past six months. Last week, the altcoin jumped to its highest level since August on the back of Bitcoin’s rally and broader market sentiment before slightly pulling back.
Despite its downtrend, Litecoin has achieved remarkable milestones over the past month. The digital currency set a record in its network’s hashrate. The Litecoin Foundation took to X (formerly Twitter) to announce the milestone reached. Litecoin has set a new ATH in its network hashrate, an indicator of the overall security of a blockchain network. Mining hashrate is a key security metric since more hashing power in the network signifies greater security and better chances at overall resistance to attacks. The Litecoin hashrate has grown from 1 TH/s in August 2014 to over 750 TH/s in August this year.
Earlier in October, Litecoin celebrated its 12th birthday, marking 12 years of zero downtime. The Litecoin network has recorded 180 million transactions throughout the period, highlighting growth in its usage and an increase in its adoption on the market.
Additionally, data by Santiment revealed a surge in on-chain activity and whale transactions, reaching four-month highs, suggesting increased market interest. As of last week on Wednesday, the number of daily transactions on the network rose to 319,000- its highest level since June this year, suggesting a bullish outlook for LTC despite its price struggles.
Litecoin Price Analysis
Litecoin price has been moving sideways over the past few days, exhibiting signs of exhaustion from its recent rally. The digital currency has failed to start a fresh rally above the crucial level of $72.80. Litecoin remains above and below the 50-day and 200-day exponential moving averages, respectively. Its Moving Average Convergence Divergence (MACD) indicator signals a buy. Its RSI is slightly above the neutral level at 57.
As such, the Litecoin price outlook remains uncertain in the near term as the altcoin struggles to find direction. A breach above the immediate resistance level of $72.80 might pave the way for further gains to $80. However, a failure to break above the level could trigger a breakdown of the RSI’s 50 level, enforcing a bearish outlook.
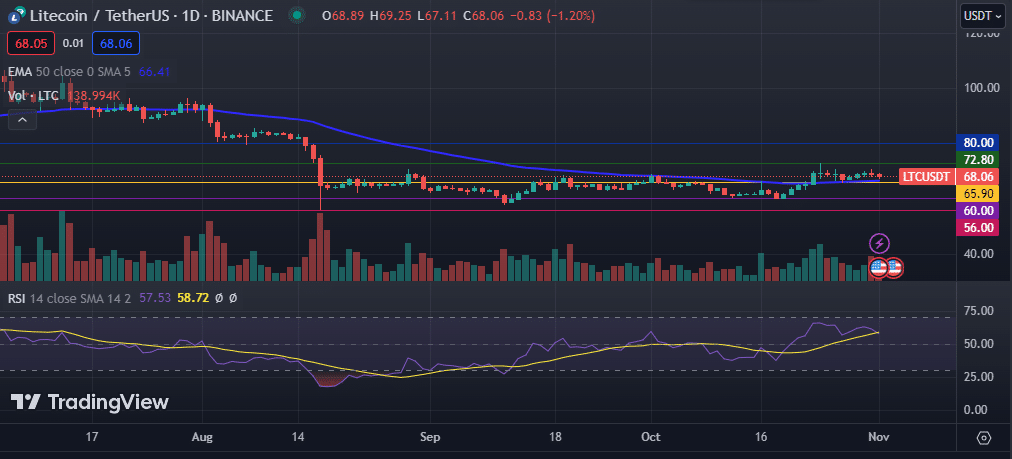
LTC Price Chart


BNB price has noted significant gains over the past few days, surging past the psychological resistance of $300. The native cryptocurrency of the Binance Exchange has surpassed Solana to regain its position as the fourth-largest cryptocurrency by market cap. The digital currency has been rallying lately with a 7-day profit of more than 15%. Additionally, BNB has clocked a phenomenal gain of 38% in the month to date.
Binance Coin Outlook
BNB price has been on a strong bull run for the past week, breaking out of its consolidation. Even so, the asset has experienced a correction in its uptrend over the past 24 hours but remains above the crucial level of $300. BNB’s total market cap has decreased by 4% over the past day to $48 billion, while the total volume of the asset traded over the same period dipped by about 15%.
Over the past year, Binance Coin has had to cope with Fear, Uncertainty, and Doubt (FUD) on the back of the regulatory troubles of its underlying exchange. Earlier, the BNB price touched a low of $223.50, a few days after its former CEO, Changpeng Zhao, pleaded guilty to money laundering charges. However, the cryptocurrency has managed to rebound 46% in value since then.
The recent price rally has been associated with various positive developments in the Binance ecosystem, including the Introduction of the Isolated Margin Auto-Transfer Mode. This feature enables…
Solana price performance in recent times has been remarkable, surpassing Ripple and Binance Coin to become the fourth-largest cryptocurrency by market cap. The SOL price breached the critical level of $100 for the first time since April 2022 over the weekend to imbue optimism among investors. However, the altcoin has corrected by 7%, suggesting that the market is overheated. At the time of writing, the ‘Ethereum killer’ was trading slightly lower at $111.60.
SOL Outlook
Solana price has made a significant recovery over the past few weeks, climbing above the psychological level of $100. The altcoin has been one of the best-performing assets this year, extending its year-to-date gains to more than 1,025%, with more gains recorded in the past month alone. However, even with such growth, analysts have noted that Solana has a bleak chance of topping its ATH of $260.
The reason behind this is the increase in supply relative to its value. In November 2021, when the Solana price hit its all-time high of $260, its total market capitalization was around $78 billion. Despite the value of the crypto asset being less than half of what it was at the top, its market cap is currently hovering near $50 billion.
This has been brought about by the increase in the Solana supply by more than 100 million SOL over the past two years. According to some analysts, for the altcoin to retest $260, its…

Solana price has noted significant gains over the past few weeks, climbing to its highest level since April 2022. The ‘Ethereum Killer’ almost topped the crucial level of $100 on Friday, before pulling back slightly. The asset’s recent surge has catapulted Solana’s total market cap to $39.6 billion, ranking 5th after and above BNB and XRP, respectively. Solana has jumped by more than 22% in the past week and more than 80% in the month to date. At the time of writing, SOL price was trading 0.90% lower at $93.10.
Catalysts Behind SOL’s Rally
Solana price has been on a strong bull run over the past few days, rocketing to its highest level in 20 months as the network benefits from the substantial activity and strong interest in memecoins. The SOL token, the native digital asset of the high-performance blockchain platform Solana, has shown some serious strength over the past few weeks, outperforming all the altcoins in the market.
The recent surge in the Solana price has been linked to heightened on-chain activities on the Solana blockchain. Notably, the ongoing hype for the blockchain’s speedy transactions, cheap fees, and a lottery of meme coin issuances has buoyed SOL’s on-chain activity. Metrics have revealed that Solana has been the strongest draw among on-chain traders, with trading volumes and network fees outperforming Ethereum- the largest altcoin by market cap.
Cited figures provided by DeFi aggregator DeFiLlama…


-
 Blogs7 years ago
Bitcoin Cash (BCH) and Ripple (XRP) Headed to Expansion with Revolut
-
 Blogs7 years ago
Another Bank Joins Ripple! The first ever bank in Oman to be a part of RippleNet
-
 Blogs7 years ago
Standard Chartered Plans on Extending the Use of Ripple (XRP) Network
-
 Blogs7 years ago
Electroneum (ETN) New Mining App Set For Mass Adoption
-
 Don't Miss7 years ago
Ripple’s five new partnerships are mouthwatering
-
 Blogs7 years ago
Cryptocurrency is paving new avenues for content creators to explore
-
 Blogs7 years ago
Ethereum Classic (ETC) Is Aiming To Align With Ethereum (ETH)
-
 Blogs7 years ago
Is Litecoin (LTC) Changing Its Game Plan By Going For Mass Adoption?


