Altcoins
Litecoin Price Multi-Timeframe Analysis Points to More Gains

Litecoin price moved sideways on Monday as investors embraced a risk-off sentiment. The coin was trading at $97.24, which was a few points below the year-to-date high of $102. Litecoin has been one of the best-performing big-cap cryptocurrencies in the world. Unlike most coins, its rally started in June last year when it dropped to a low of $47.85.
Litecoin price analysis (1D chart)
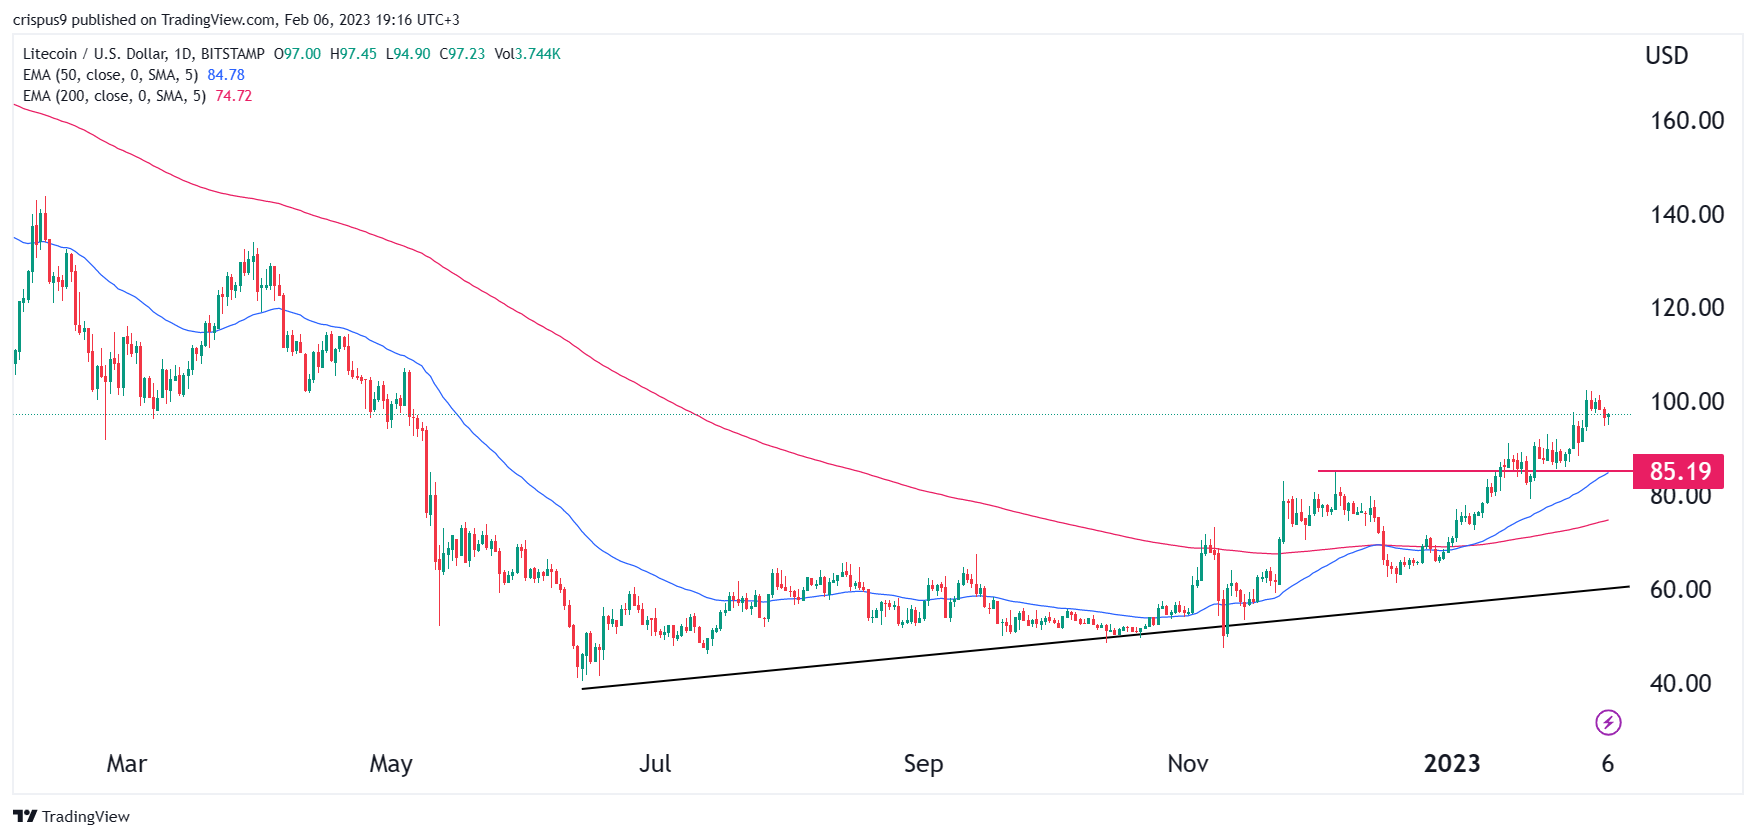
The LTC/USD price has been in a strong rally in the past few months. This rally was validated when the coin moved formed a golden cross pattern. In financial trading, this pattern forms when the 50-day and 200-day moving averages makes a bullish crossover. The cross happened on December 16.
In the past few months, Litecoin has moved above several important resistance levels. The most recent was when it moved above the key level at $85.20, the highest point on December 6. It also moved above the psychological level of $100.
The coin has also jumped above the ascending trendline shown in black. Therefore, I suspect that the bullish trend will continue as Litecoin’s hash rate continues rising. It has jumped to an all-time high, signaling that the network remains significantly healthy.
If this trend continues, Litecoin will likely continue rising as buyers target the key resistance point at $120, which is about 23% above the current level.
LTC/USD price 4H analysis
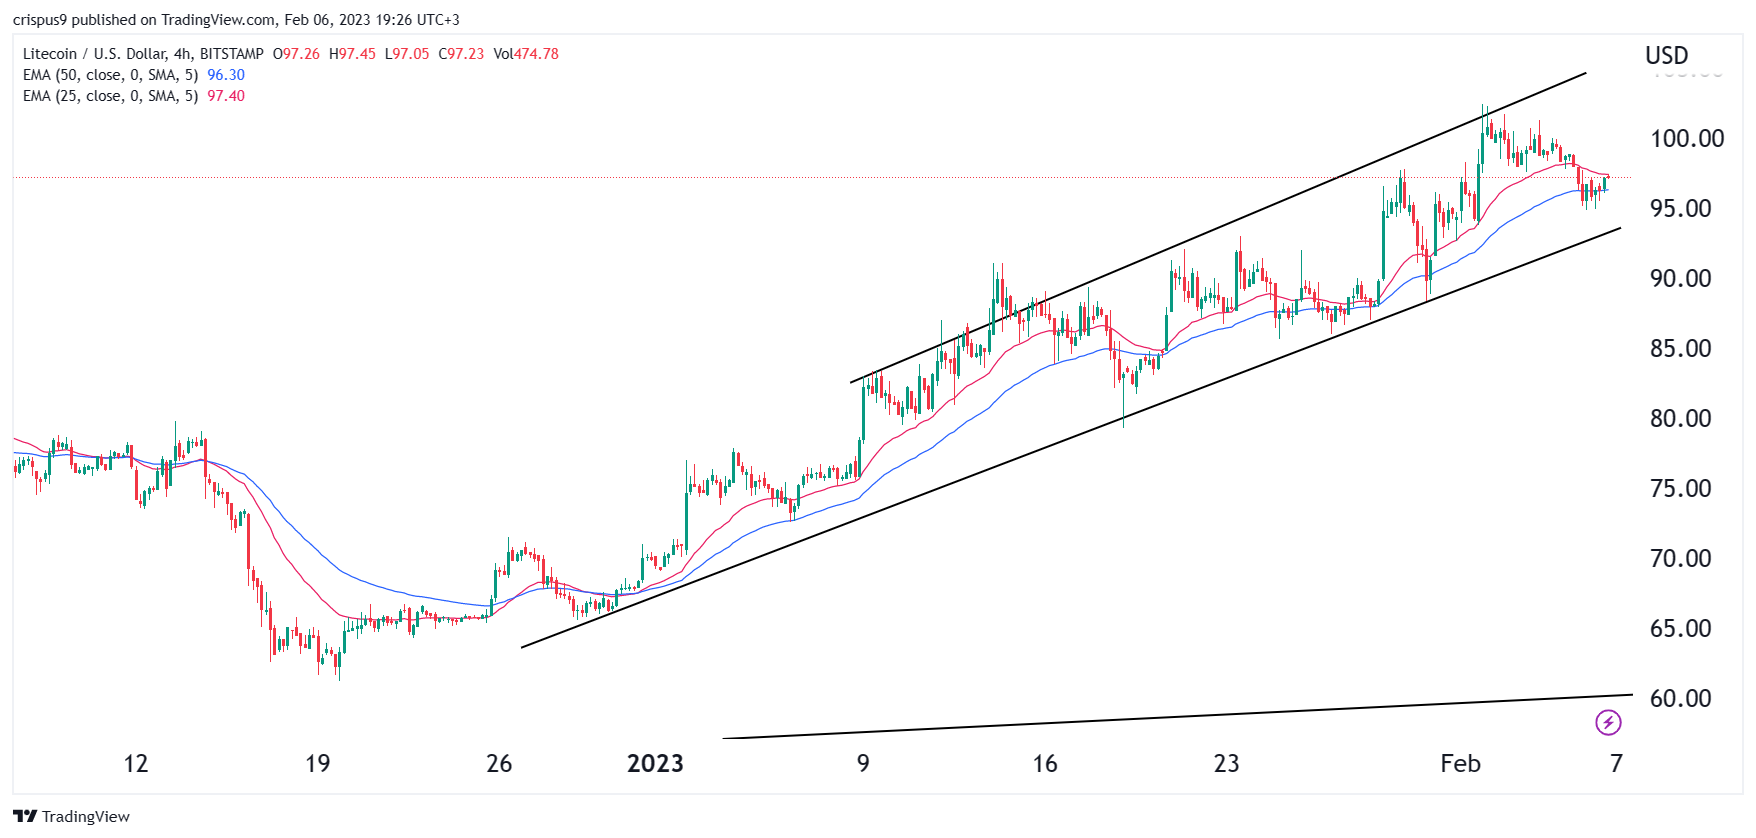
Turning to the 4H chart, we see that the LTC/USD price has formed an ascending channel shown in black. The price has moved slightly below the middle line of this channel. It is also consolidating at the 25-day moving averages. Therefore, while the coin has made a slight pullback, I suspect that the bullish trend will continue in the coming days.
If this is accurate, the coin will likely retest the important resistance level at $102.16, the highest point this year. A move above that resistance point will see the Litecoin price continue soaring, with the key level to watch being at $120. This view is in line with that on the daily chart.