Bitcoin
Bitcoin (BTC) Ethereum (ETH) Price Analysis: A Series of Clues

As a technician, I tend to pay a lot of attention when a chart starts to reaffirm some signals underneath the surface of the action. In other words, a chart is a record of clues. But to fully trust those clues, you need to see additional signposts suggesting that your interpretation is flowing down the right track.
In the case of the cryptocurrency complex over the past month, we have seen a series of important clues and confirmation signals that are very suggestive of the possibility that an important change in the overall tone of this market has already come into place.
As we take a closer look at Bitcoin (BTC) and Ethereum (ETH) today, we will discuss these clues along with some of the signals of confirmation.
Bitcoin (BTC)
Price Analysis
- High: $8216.7
- Low: $8135.7
- Major Resistance Level: $8600
- Hourly MACD: Continuation Momentum

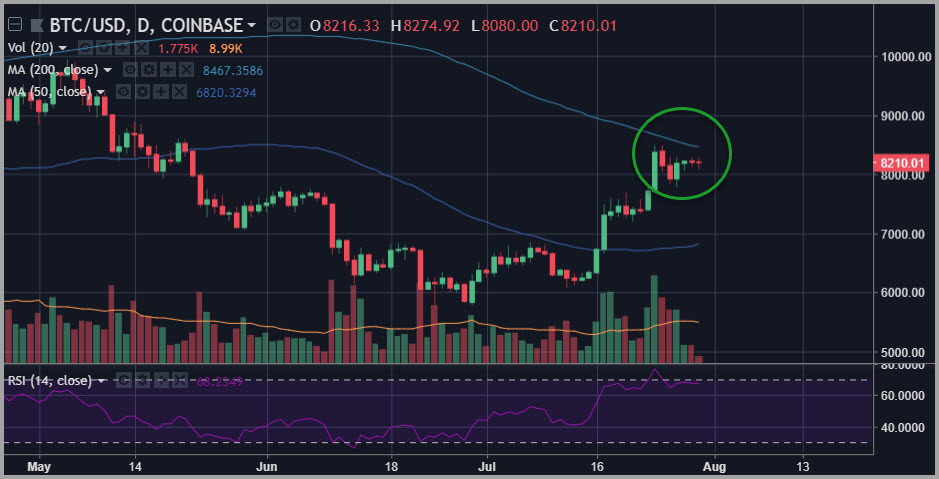
Chart courtesy of tradingview.com
There is no question that Bitcoin (BTC) has been well out in front and truly set the tone for the bounce that we have seen dominating the cryptocurrency complex over the past several weeks.
However, one interesting thing that we haven’t seen – interestingly enough – is a test of the 200-day simple moving average in Bitcoin (BTC). This is despite the fact that we have seen the 14-day RSI measure hit fully overbought levels.
Given the composition of this chart pattern, that’s interesting and somewhat unexpected.
However, what we have seen is a massive breakout above the 50-day simple moving average on enough volume to turn heads. In addition, we are already beginning to see the slope of that key moving average start to curl and turn to the upside as the volume grows.
This is an important signal and suggests the possibility that a pullback from here may well find support at that rising average setting the terms for a reinforcement of a new direction of the trend in the framework of a series of higher highs and higher lows.
Ethereum (ETH)
Price Analysis
- High: $471.39
- Low: $468.07
- Major Resistance Level: $500
- Hourly MACD: Lateral Consolidation Coming to a Head

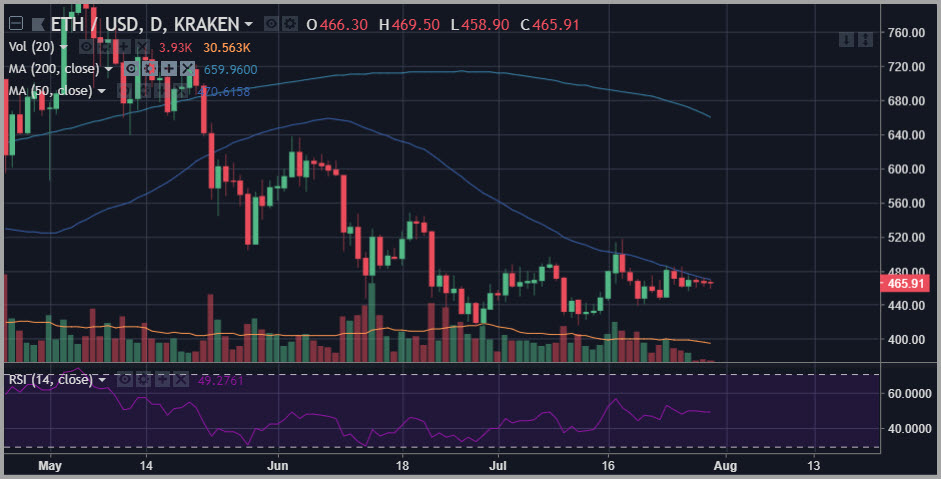
Chart courtesy of tradingview.com
As we have noted, Ethereum (ETH) has been lagging, particularly when compared to Bitcoin (BTC). However, it has still done some important things.
To continue to represent the upside potential that longs in this market hope to see, the most important factor will be for ETH to continue to hold its rising trendline formed on the basis of the lows seen in late June, mid-July, and last week.
This will be critical as the coin presses against several important resistance levels, the most important of which clearly is the $500 level.
We will continue to track Ethereum (ETH) and look for all of these signals in coming days. Given that it represents such an important aspect of the cryptocurrency complex – becoming something of a proxy for the “smart contract disruption” facet – we would feel more confident in the larger cryptocurrency theme as a rejuvenated bull market coming to fruition if we saw some leadership begin to emerge on the charts in Ethereum (ETH).
Happy Trading~
For the latest cryptocurrency news, join our Telegram!
Disclaimer: This article should not be taken as, and is not intended to provide, investment advice. Global Coin Report and/or its affiliates, employees, writers, and subcontractors are cryptocurrency investors and from time to time may or may not have holdings in some of the coins or tokens they cover. Please conduct your own thorough research before investing in any cryptocurrency and read our full disclaimer.
Image courtesy of Pexels
Charts courtesy of tradingview.com