Blogs
EOS Litecoin (LTC) Price Analysis: Critical Test in Progress

It’s very important to appreciate the process of a developing differentiation among the vehicles that we may consider to be the important players in the cryptocurrency complex at present. Too many traders still think of it as “Bitcoin and the Alt-coins” – like some kind of 1950s boogie-woogie band.
In fact, we are seeing the maturation of a rich tapestry of pieces on the chess board of the cryptocurrency complex as a whole. By and large, correlation levels are falling, and differentiation is entering the public trading zeitgeist as well as the chart patterns.
We are going to spend some time in the piece below taking a close and objective look at EOS and Litecoin (LTC), with an eye on spotting signals that the charts may be showing to guide us in our analysis.
EOS
Price Analysis
- High: $7.1544
- Low: $6.9518
- 24-Hour Volume: $489.38M
- 7-day Percent Change: -13.1%

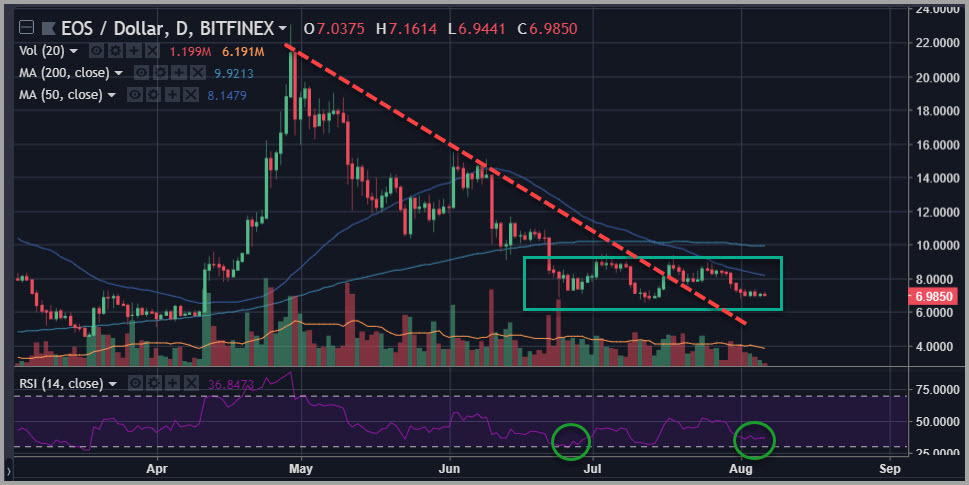
Chart courtesy of tradingview.com
As we have noted in our prior coverage, EOS has been somewhat of an outperformer when you consider the broad landscape of cryptocurrency action going back to late 2017.
In fact, this is one of the rare coins that made a new all-time high during the spring of this year, exceeding its winter highs that were so dominant among those major players in the complex that tagged along with the Bitcoin mania into the introduction of Bitcoin futures on the Chicago Mercantile exchange in mid-December of 2017.
EOS has been on a bit of a roller coaster ride over the past six weeks, bouncing back and forth between $6.50 and $9.00 dollars in a wide trading range.
At this point, we are testing that support area once again, and getting no particular help from the major oscillators or indicators. Right now, it comes down to support from the chart level around the $7 dollar area to hold firm and prevent a dip down to test the April lows more than a dollar lower.
Litecoin (LTC)
Price Analysis
- High: $76.712
- Low: $73.691
- 24-Hour Volume: $278.94M
- 7-day Percent Change: -8.86%

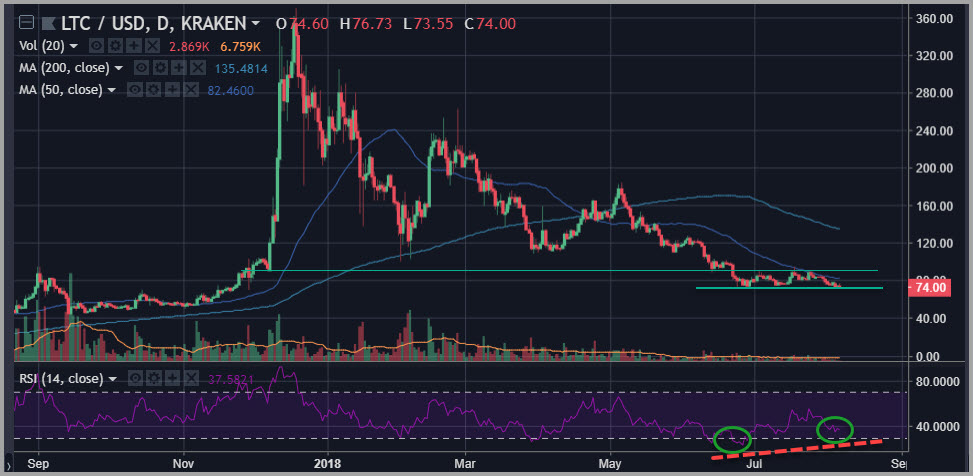
Chart courtesy of tradingview.com
Litecoin (LTC) is possibly granting us a technical signal that should not be ignored: if support found over the last 48 hours were to hold, we would have in place on the daily chart a mammoth bullish divergence on the 14-day RSI indicator, when compared to the levels reached in both the price and the oscillator toward the end of June.
This type of indication can be extremely important in forming lows.
We would also point out that we have surpassed support levels in this coin that should have been important and may signal seller exhaustion now that we have stagnated beyond them and formed a bullish divergence like this in an important indicator.
Our advice is as follows: if you have been bullish on Litecoin (LTC) but haven’t pulled the trigger yet, you may want to give this one a serious look right now.
Happy Trading~
For the latest cryptocurrency news, join our Telegram!
Disclaimer: This article should not be taken as, and is not intended to provide, investment advice. Global Coin Report and/or its affiliates, employees, writers, and subcontractors are cryptocurrency investors and from time to time may or may not have holdings in some of the coins or tokens they cover. Please conduct your own thorough research before investing in any cryptocurrency and read our full disclaimer.
Image courtesy of Pexels
Charts courtesy of tradingview.com