Blogs
IOTA Tron (TRX) Price Analysis — Key Levels Come Under Fire

We noted in some of our recent analysis that a pullback across the cryptocurrency complex was more than likely. Now, we are seeing just that.
Today, as we take a close look at the charts for IOTA and Tron (TRX), we see a bit more vulnerability than we have seen in some of our other markets. In fact, we noted just yesterday that both of these coins represented some immediate technical vulnerability.
However, the important part will be how they respond to this dip – which is still very much an open question.
IOTA
Price Analysis
- High: $0.94717
- Low: $0.91027
- Major Resistance Level: $1.20
- Hourly MACD: Bounce Underway

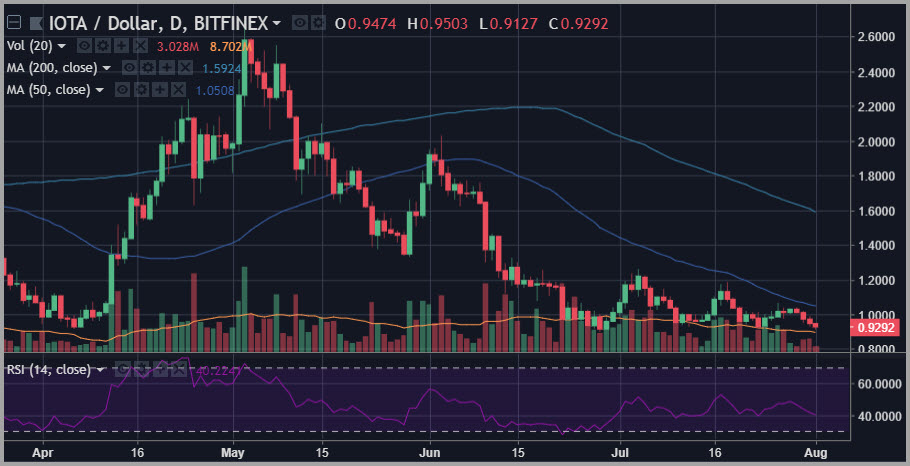
Chart courtesy of tradingview.com
IOTA is one we recently picked out as a chart with a particularly bearish near-term pattern, but a pattern that could also flip and become a bullish signal if the market was able to respond in the right manner to new levels brought into focus on the downside as initial support levels gave way.
Whether or not we will begin to see this type of rescue bid in IOTA is still very much an open question as it takes time to paint a picture that can be trusted on a chart.
At this point, as we have noted a number of times, the region between $0.85 and $0.90 is really where the rubber meets the road.
What we really don’t want to see here – from the perspective of current IOTA HODLers – is a break that closes a 24-hour period below $0.80.
Tron (TRX)
Price Analysis
- High: $0.033901
- Low: $0.032399
- Major Resistance Level: $0.04
- Hourly MACD: Downward Trending

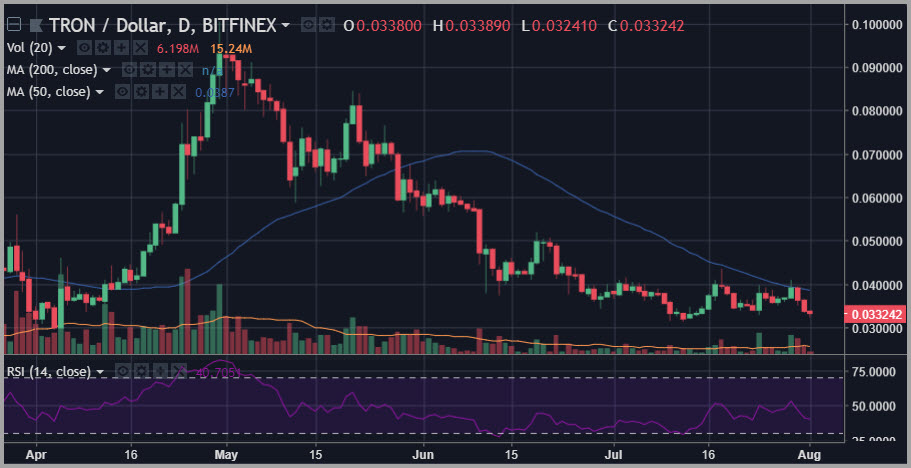
Chart courtesy of tradingview.com
As we take a look at Tron (TRX) right now, some technical damage has definitely been done. First off, the potential for an ascending triangle breakout above the $0.04 level has been eradicated at this point.
We noted in our recent coverage that this was possible. Our concern was that it might take out the sloped trendline support brought into place over the last couple of weeks before it was able to break above recent range resistance.
Given the turn in the complex, we have in fact broken that trendline in Tron (TRX) and are now setting up to seriously challenge key support levels.
For this chart, in particular, that presents the possibility of a shakeout of weak-handed participants, which could bring into play support levels last seen in March in TRX at around $0.025.
Happy Trading~
For the latest cryptocurrency news, join our Telegram!
Disclaimer: This article should not be taken as, and is not intended to provide, investment advice. Global Coin Report and/or its affiliates, employees, writers, and subcontractors are cryptocurrency investors and from time to time may or may not have holdings in some of the coins or tokens they cover. Please conduct your own thorough research before investing in any cryptocurrency and read our full disclaimer.
Image courtesy of Pexels
Charts courtesy of tradingview.com