Blogs
Stellar (XLM) Cardano (ADA) Price Analysis: Timing is Everything

As we have noted in the past, trend direction is rarely if ever actually changed by new headlines in the news. This doesn’t mean it can’t be interrupted by headlines – in fact, it often is. However, the larger direction in the market is almost never infected and altered to become a different direction by new headlines emerging in the media.
That is why we pay so much attention to the charts.
The clues often show up there first. Today we are going to be taking a close look at Stellar (XLM) and Cardano (ADA) with just such a process in mind.
Stellar (XLM)
Price Analysis
- High: $0.3254
- Low: $0.2661
- Major Resistance Level: $0.32
- Hourly MACD: Oversold Bull Signal

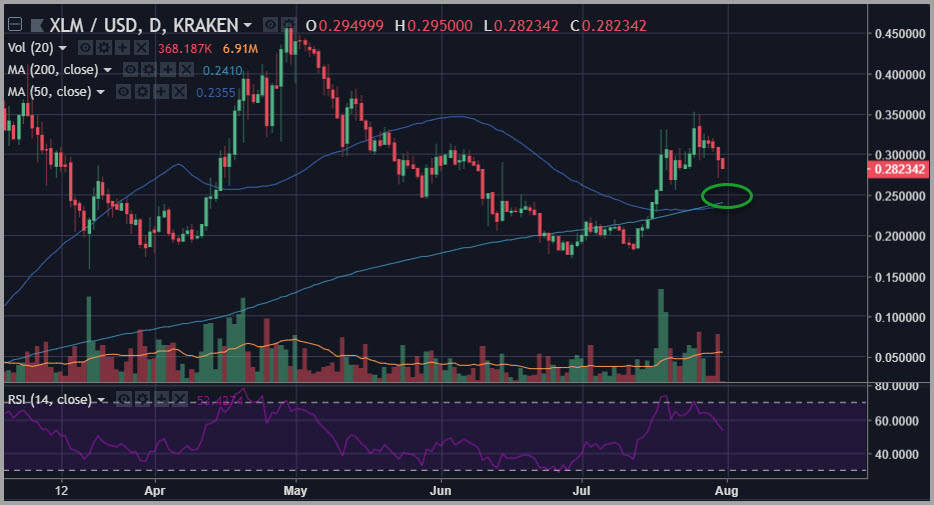
Chart courtesy of tradingview.com
As one of the leaders during this complex-wide bounce, Stellar (XLM) continues to show both stunning volatility and strong support.
For those looking to buy into a dip, we suggested in a recent piece that you look for a break down underneath the $0.28-$0.30 level as a signal for a possible buyable dip. For those with that game plan, we have seen such a dip over the past 24 hours.
At the same time, as noted above, we see an oversold bull signal in the MACD to reinforce the idea that this is a pullback of interest in Stellar (XLM).
For those looking to give it more time and space to come in a bit further, we have perfect confluence right now between the 50-day and 200-day simple moving averages, which are both rising in pitch, and may well end up meeting price on a pullback right at the $0.25 level. This would also correspond with matching support from the lows recorded on July 21.
That could be set up as an impeccable tactical pullback setup in Stellar (XLM) for those with the patience to take advantage.
Cardano (ADA)
Price Analysis
- High: $0.16658
- Low: $0.14367
- Major Resistance Level: $0.20
- Hourly MACD: Oversold Bull Potential

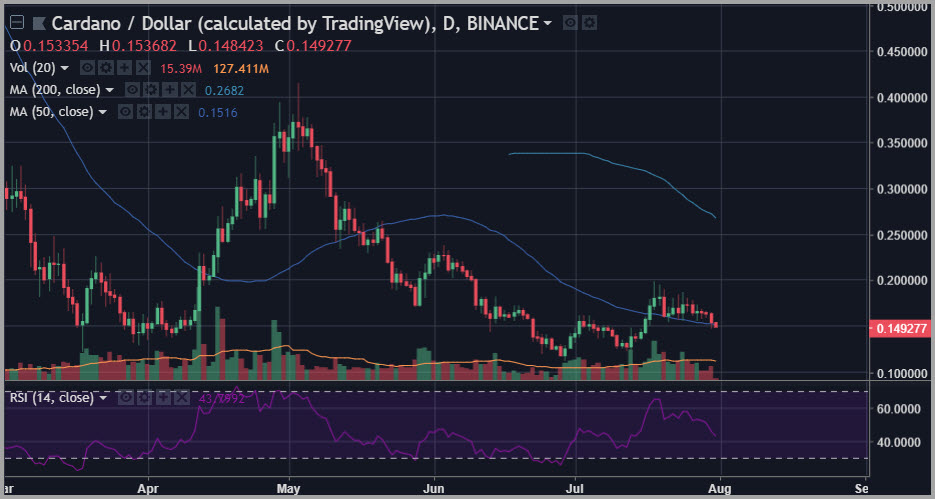
Chart courtesy of tradingview.com
The action right now in Cardano (ADA) is very interesting. First off, we have a coin that outperformed during the mid-July leg of the cryptocurrency complex strength, rising over 50% in just a few days.
Secondly, we set the stage with a sideways range that narrowed to a head over the course of about 10 days and then began to break lower early this week. Now that breakdown is triggering an oversold reading on the MACD indicator in perfect confluence with a test of support at the 50-day simple moving average.
However, the question is this: have we seen enough of a pullback given the duration in the tightness of the sideways triangle consolidation constructed over the past 10 days?
In this case, there are no perfect answers to that question, and time will have to tell.
However, we can say that the $0.15 level is an awfully important technical level for this coin right now. Bulls in Cardano (ADA) certainly don’t want to see this level taken out too sharply or it could be an awfully difficult thesis to stay with.
Happy Trading~
For the latest cryptocurrency news, join our Telegram!
Disclaimer: This article should not be taken as, and is not intended to provide, investment advice. Global Coin Report and/or its affiliates, employees, writers, and subcontractors are cryptocurrency investors and from time to time may or may not have holdings in some of the coins or tokens they cover. Please conduct your own thorough research before investing in any cryptocurrency and read our full disclaimer.
Image courtesy of Pexels
Charts courtesy of tradingview.com