Blogs
XRP Bitcoin Cash (BCH) Price Analysis: The Fork in the Road

Clearly, we are seeing some tidal changes across the cryptocurrency asset class from a bird’s eye view. Right now, we have at hand what must be seen as a defining moment for many different large market cap coins.
In the piece below, we are going to focus closely on XRP and Bitcoin Cash (BCH), not only because they are highly interesting potential opportunities in and of themselves, but because they also exemplify some of the dynamics going on that define the space as a whole.
XRP
Price Analysis
- High: $0.43655
- Low: $0.42535
- 24-Hour Volume: $187.82M
- 7-day Percent Change: -3.69%

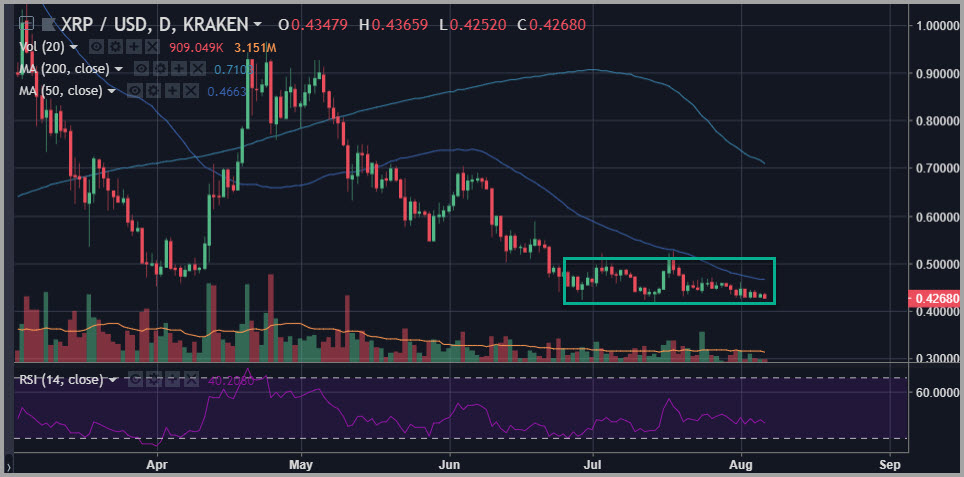
Chart courtesy of tradingview.com
XRP is extremely interesting right now because, more than anything, this coin is showing an almost impossible resiliency in terms of its ability to hold critical support around the $0.43 level.
We have seen seven separate instances of extremely strong support form between the $0.42 and $0.43 levels in XRP over the past five weeks. It has been an extraordinary show of powerful support that clearly marks out a binary outcome with profound implications.
I say there are two possible outcomes here. And only a fool – who, as we know, is easily parted from his money – would suggest anything else. In fact, this is the essence of technical analysis: one must remain empirical and objective, and avoid becoming married to one side or the other of the tape.
While it has been impressive to see the support level hold, if it fails to do so on the eighth attempt, the results could be rather disastrous for those XRP HODLers who have no exit plan at all. Yet, at the same time, for those who gave up on the seventh check of support (or the sixth, fifth, fourth, or third), they may feel equally as bad when they see this back above the $0.50 level.
In other words, as we see these types of repeated proofs of a level, the emotion surrounding one outcome or the other intensifies because the attachment to one’s views of how this will work out intensifies by equal measure.
This will be key to watch.
Bitcoin Cash (BCH)
Price Analysis
- High: $719.74
- Low: $691.99
- 24-Hour Volume: $312.81M
- 7-day Percent Change: -12.79%

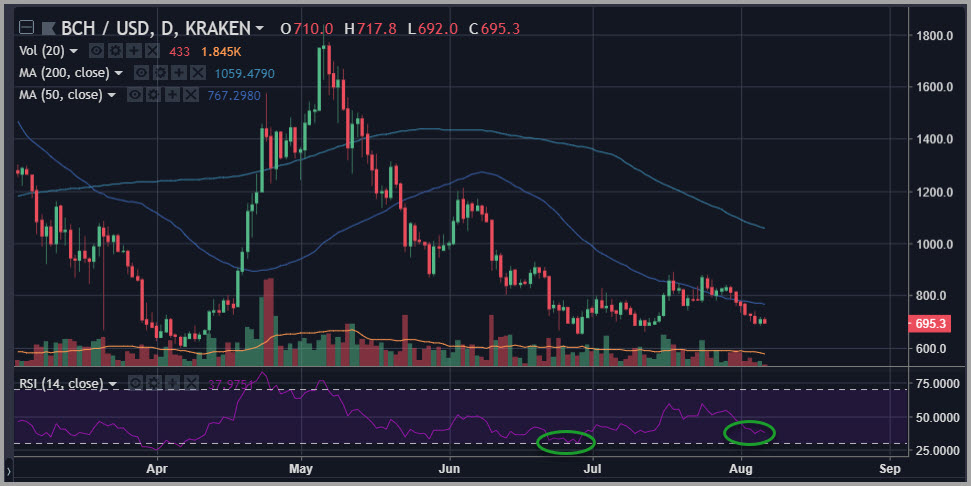
Chart courtesy of tradingview.com
Bitcoin Cash (BCH) has been a very interesting process under development. We have seen this coin lead during certain periods over the past month and lag during others.
At this point, the coin has fallen back solidly below its 50-day simple moving average, but has already triggered an oversold reading on the 14-day RSI – and has done so well above its lows from late June. This could be important as something like a bullish divergence.
At this point, Bitcoin Cash (BCH) is beginning to trigger a possible “buy signal” on the MACD indicator following its hold of support at the $685 level.
This is actually an important level marked by the shoulders of a short timeframe inverted head-and-shoulders pattern that we saw come into construction around the pivot lows toward the middle of July.
As we attempt to mark out the boundaries of a possible bounce in Bitcoin Cash (BCH) over the coming hours and days, we would look for a possibly important challenge of resistance at the $740 level.
Happy Trading~
For the latest cryptocurrency news, join our Telegram!
Disclaimer: This article should not be taken as, and is not intended to provide, investment advice. Global Coin Report and/or its affiliates, employees, writers, and subcontractors are cryptocurrency investors and from time to time may or may not have holdings in some of the coins or tokens they cover. Please conduct your own thorough research before investing in any cryptocurrency and read our full disclaimer.
Image courtesy of Pexels
Charts courtesy of tradingview.com