
Altcoins
BNB Price Endures Two Months of Strain Following Rejection at Crucial $300 Level in June
BNB price has been under immense pressure for the past few weeks amid a decline in market volatility and risk appetite. The asset has crashed by nearly 5% in the past week, more than 25% in the past quarter, and 4.75% in the year to date. At press time, Binance Coin was trading lower at $234.7. BNB’s total market cap has slipped by 2% over the last day to $36 billion, ranking it the 4th cryptocurrency. On the other hand, the total volume of BNB traded over the same period has jumped by 37.45%.
Economic Concerns
BNB price has been in the red for several weeks now amid a decline in the crypto market sentiment and a lack of momentum to sustain an upward trajectory. The global crypto market cap has plunged by nearly 2% over the last day to $1.15 trillion, while the total crypto market volume increased by 23%. Bitcoin, the largest cryptocurrency by market capitalization, has been range bound for the past few weeks, weakening the market sentiment. Most altcoins, including Ethereum, XRP, Dogecoin, Cardano, Solana, Polygon, and Polkadot, have been in the red for the past week.
The Crypto Fear and Greed Index, which measures the key emotions driving the cryptocurrency market, has declined to a Fear level of 49. A Fear reading usually indicates that investors are having doubts about the market, ramping up the selling pressure against the backdrop of a decline in risk appetite.
Investors will be closely watching the release of the FOMC meeting minutes for July, hunting for clues about the Fed’s economic expectations and interest rate path. Since their last meeting in July, there have been mixed signals about whether the central bank would continue with its interest rate hike campaign or whether it would hit pause soon.
US Treasury yields hit an almost 10-month high on Wednesday buoyed by expectations that the Federal Reserve is not yet done with its rapid monetary tightening cycle. On Tuesday, Minneapolis Federal Reserve President Neel Kashkari noted that the central bank is still a long way from cutting rates. An environment of higher interest rates tends to be bearish for risk assets such as stocks and particularly cryptocurrencies.
BNB Price Technical Analysis
BNB price has failed to start a fresh incline over the past two months, after facing a strong rejection at the important resistance zone of $300. The digital asset remains below the 50-day and 200-day exponential moving averages, as well as the 50-day and 100-day simple moving averages.
Its Relative Strength Index (RSI), as well as the Moving Average Convergence Divergence (MACD) indicator, has dropped below the signal line, hinting at an increase in selling pressure. The Bollinger Bands have narrowed as seen on the daily chart, indicating a decline in market volatility.
Therefore, I expect the BNB price to fall further in the coming days amid global economic uncertainty. If this happens, the next support levels to watch will be $230 and $220. On the flip side, a move above the 50-day EMA at $245.5 might pave the way for further increases.
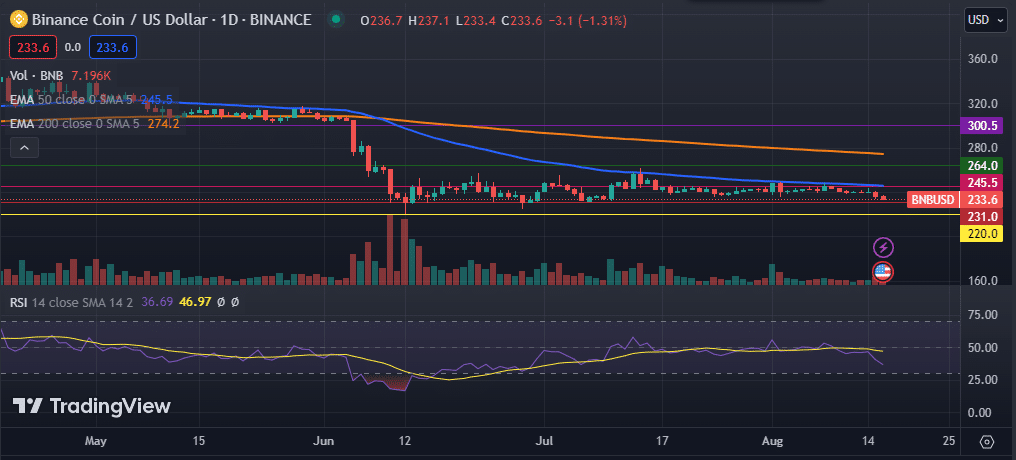
BNB Price Chart


Solana price performance in recent times has been remarkable, surpassing Ripple and Binance Coin to become the fourth-largest cryptocurrency by market cap. The SOL price breached the critical level of $100 for the first time since April 2022 over the weekend to imbue optimism among investors. However, the altcoin has corrected by 7%, suggesting that the market is overheated. At the time of writing, the ‘Ethereum killer’ was trading slightly lower at $111.60.
SOL Outlook
Solana price has made a significant recovery over the past few weeks, climbing above the psychological level of $100. The altcoin has been one of the best-performing assets this year, extending its year-to-date gains to more than 1,025%, with more gains recorded in the past month alone. However, even with such growth, analysts have noted that Solana has a bleak chance of topping its ATH of $260.
The reason behind this is the increase in supply relative to its value. In November 2021, when the Solana price hit its all-time high of $260, its total market capitalization was around $78 billion. Despite the value of the crypto asset being less than half of what it was at the top, its market cap is currently hovering near $50 billion.
This has been brought about by the increase in the Solana supply by more than 100 million SOL over the past two years. According to some analysts, for the altcoin to retest $260, its…

Solana price has noted significant gains over the past few weeks, climbing to its highest level since April 2022. The ‘Ethereum Killer’ almost topped the crucial level of $100 on Friday, before pulling back slightly. The asset’s recent surge has catapulted Solana’s total market cap to $39.6 billion, ranking 5th after and above BNB and XRP, respectively. Solana has jumped by more than 22% in the past week and more than 80% in the month to date. At the time of writing, SOL price was trading 0.90% lower at $93.10.
Catalysts Behind SOL’s Rally
Solana price has been on a strong bull run over the past few days, rocketing to its highest level in 20 months as the network benefits from the substantial activity and strong interest in memecoins. The SOL token, the native digital asset of the high-performance blockchain platform Solana, has shown some serious strength over the past few weeks, outperforming all the altcoins in the market.
The recent surge in the Solana price has been linked to heightened on-chain activities on the Solana blockchain. Notably, the ongoing hype for the blockchain’s speedy transactions, cheap fees, and a lottery of meme coin issuances has buoyed SOL’s on-chain activity. Metrics have revealed that Solana has been the strongest draw among on-chain traders, with trading volumes and network fees outperforming Ethereum- the largest altcoin by market cap.
Cited figures provided by DeFi aggregator DeFiLlama…
Solana price has jumped more than 8% over the past week, breaching the important level of $60. At the time of writing, Solana was trading 3% higher at $61.07. The asset’s total market cap has climbed to $25.9 billion over the past week, ranking it the 6th largest cryptocurrency after XRP. The total volume of SOL traded over the last day has declined by 8%.
SOL’s Bullish Cues
Solana’s price has been among the best-performing cryptocurrencies this year amid continuous growth. The “Ethereum killer” has consistently impressed investors throughout the year on the back of a resurgence in bullishness, which saw SOL’s price climb more than 513% in the year to date. Institutional investors have also shared the bullish sentiment, making Solana their most preferred altcoin.
In the week ending November 24, Solana recorded inflows worth nearly $3.5 million, significantly more than the other altcoins’ inflows combined. The asset’s monthly inflows were higher at $40.2 million, lower than Ethereum’s $99.6 million inflows in the same period. Other altcoins, including Litecoin and Ethereum, noted significant outflows, making Solana nearly half of the home for DeFi. This implies that when it comes to institutions, Solana is currently the best-performing altcoin with the potential of a long-term rally much higher than other digital assets.
Notably, the Solana DeFi ecosystem accomplished a significant milestone earlier this week. Its Total Value Locked (TVL) hit a new yearly peak of over $655 million,…


-
 Blogs7 years ago
Bitcoin Cash (BCH) and Ripple (XRP) Headed to Expansion with Revolut
-
 Blogs7 years ago
Another Bank Joins Ripple! The first ever bank in Oman to be a part of RippleNet
-
 Blogs7 years ago
Standard Chartered Plans on Extending the Use of Ripple (XRP) Network
-
 Blogs7 years ago
Electroneum (ETN) New Mining App Set For Mass Adoption
-
 Don't Miss7 years ago
Ripple’s five new partnerships are mouthwatering
-
 Blogs7 years ago
Cryptocurrency is paving new avenues for content creators to explore
-
 Blogs7 years ago
Ethereum Classic (ETC) Is Aiming To Align With Ethereum (ETH)
-
 Blogs7 years ago
Is Litecoin (LTC) Changing Its Game Plan By Going For Mass Adoption?


