Blogs
IOTA Tron (TRX) Price Analysis: It’s Crunch Time!

Volatility is an interesting double-edged sword for the cryptocurrency complex. But, for traders, it’s obviously the lifeblood of the project. A market that is still so inefficiently priced, still so free from the shackles of institutional market makers and algorithmic domination, and still so wide-ranging in its movement is an extraordinary opportunity at every turn, literally.
For traders involved in IOTA and Tron (TRX), such an opportunity is surely lying ahead one way or the other.
Let’s take a close look at the charts to see if we can pick up some new intel on which way is most likely over the near-term.
IOTA
Price Analysis
- High: $1.03
- Low: $0.94
- Major Resistance Level: $1.20
- Hourly MACD: Deep Oversold

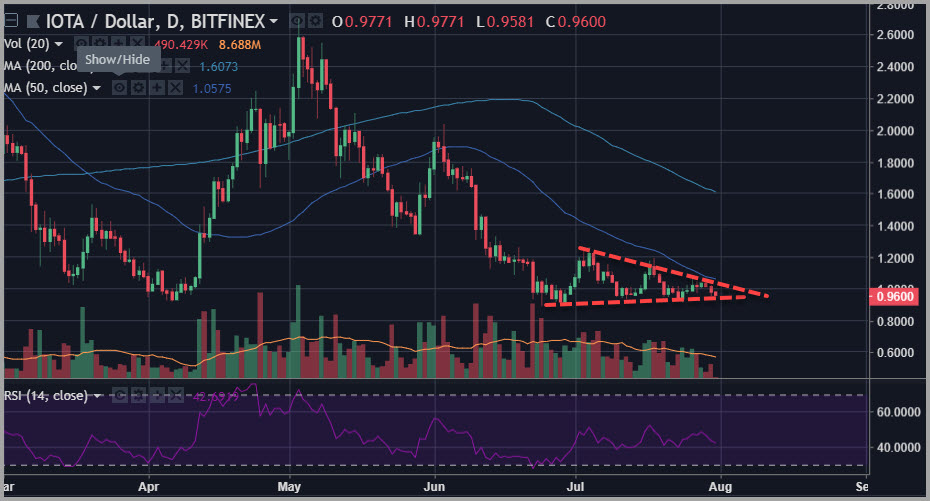
Chart courtesy of tradingview.com
IOTA is beginning to show some signs that could begin to frighten some overleveraged players out of this market. The chart has started to build out a possible bearish ascending triangle pattern that must have as a target some kind of break underneath the key support level at $0.88.
None of that means IOTA is going to break lower. However, it does mean that the pattern poses a greater risk.
This can, in fact, turn into a bullish pattern for IOTA simply by refusing to break down despite the presence of what looks – at least right now on its face – as a bearish pattern.
In other words, it is often the case that the best directional bets are placed on something that looks as bad as possible and yet refuses to move in the direction being signaled by the chart. One way to think about this is as follows: certain patterns transcend the need for experience in technical analysis. Everyone can feel them. Market participants become demoralized by a pattern like a descending triangle. It embodies the concept of “selling pressure”.
Hence, people probably are already giving up on IOTA and throwing in the towel. And those same people will be forced to chase back in if this refuses to break down and turns and starts to rally back above the $1.00 level.
Tron (TRX)
Price Analysis
- High: $0.036697
- Low: $0.034306
- Major Resistance Level: $0.04
- Hourly MACD: Potential Histogram Bull Signal

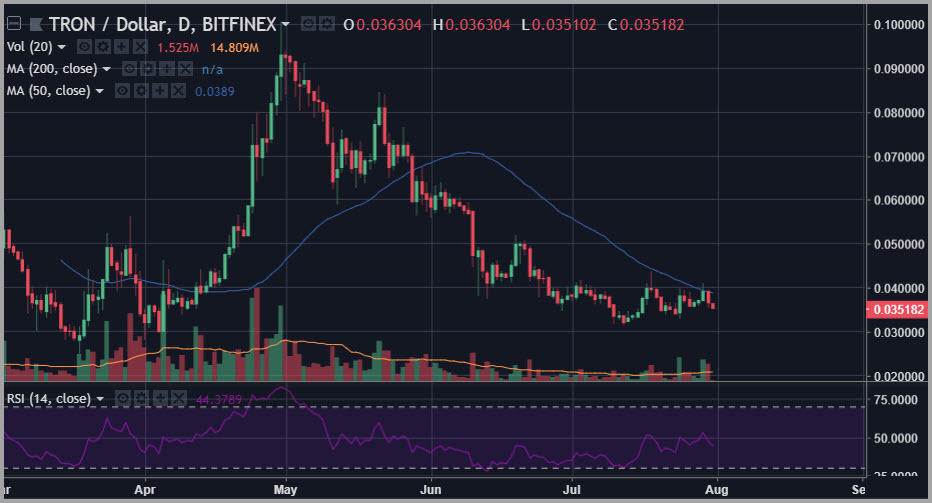
Chart courtesy of tradingview.com
Tron (TRX) poses some of the same issues discussed above for IOTA.
The pattern here is one that holds the possibility of becoming demoralizing for traders. The pressure is evident, and resistance continues to hold.
However, at the same time, a move from here back above the $0.04 level could turn everything on its head. It’s critical that one also notes where the-50 day simple moving average is at the moment – right at that same level.
Tron (TRX) is beginning to see things technically come to a head on the charts. In a sense, this is a do-or-die moment for traders involved in this coin on some level of leverage and needing a short-term signal to start to move in their favor. It may well happen, but another shakeout is certainly possible as well.
Happy Trading~
For the latest cryptocurrency news, join our Telegram!
Disclaimer: This article should not be taken as, and is not intended to provide, investment advice. Global Coin Report and/or its affiliates, employees, writers, and subcontractors are cryptocurrency investors and from time to time may or may not have holdings in some of the coins or tokens they cover. Please conduct your own thorough research before investing in any cryptocurrency and read our full disclaimer.
Image courtesy of Pexels
Charts courtesy of tradingview.com