Blogs
Stellar (XLM) Cardano (ADA) Price Analysis: Game On

When volatility increases, it is often the most important time to focus on the virtues of technical analysis.
Price changes in an asset that we value often have an impact on our psychology and our emotions that is difficult to perceive and to assess. Hence, having a toolset with a defined set of rules that specifically impinge upon how we articulate to ourselves the behavior that we are seeing can act as a cornerstone for holding ourselves accountable in our decision-making as we participate in such a volatile financial market.
As such, we would suggest that the current moment in the cryptocurrency complex is a perfect application for such a cornerstone. And we will attempt to exemplify this as we take a close look at Stellar (XLM) and Cardano (ADA).
Stellar (XLM)
Price Analysis
- High: $0.24684
- Low: $0.24255
- 24-Hour Volume: $51.26M
- 7-day Percent Change: -18.79%

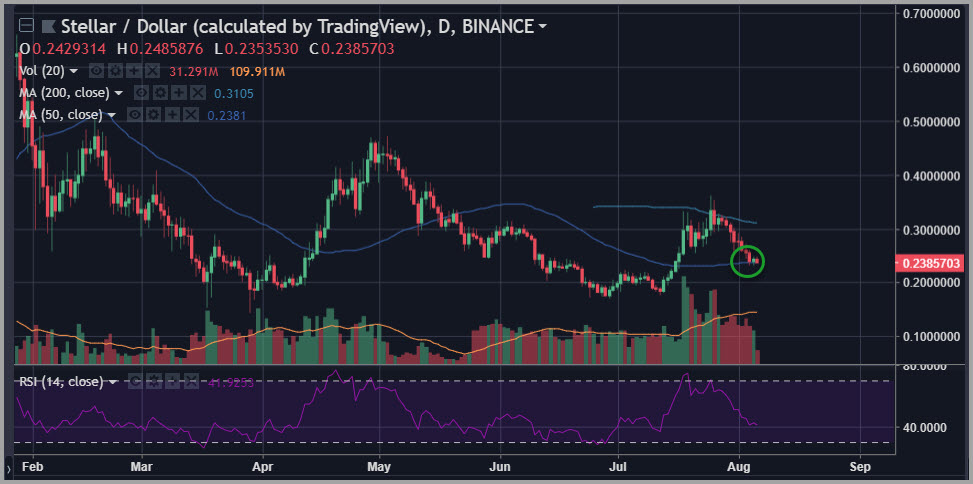
Chart courtesy of tradingview.com
Stellar (XLM) is one of the coins we find most interesting during this current pullback following the July bounce across the cryptocurrency complex. We noted last week that we thought this may well check back to under the $0.24 level, and at the same time thereby check back to key support at a rising 50-day simple moving average.
So, what we have here is as follows: Stellar (XLM) has been clearly outperforming most of the large market cap coins in the cryptocurrency asset class over the past six weeks. It has also done so on sharply rising average daily volume. And now, when the complex is pulling back, we are seeing Stellar (XLM) pullback to a level that appears to be a higher-low under formation, and finding support during that pullback at a key technical support measure that has shifted into a potentially bullish mode.
If this is possibly an important inflection in the broader crypto space leading to a new bull market, then one can easily forgive themselves for biasing their emphasis towards XLM given its recent behavior. In other words, it’s worth an extremely close look right now.
Cardano (ADA)
Price Analysis
- High: $0.13582
- Low: $0.12991
- 24-Hour Volume: $49.35M
- 7-day Percent Change: -15.71%

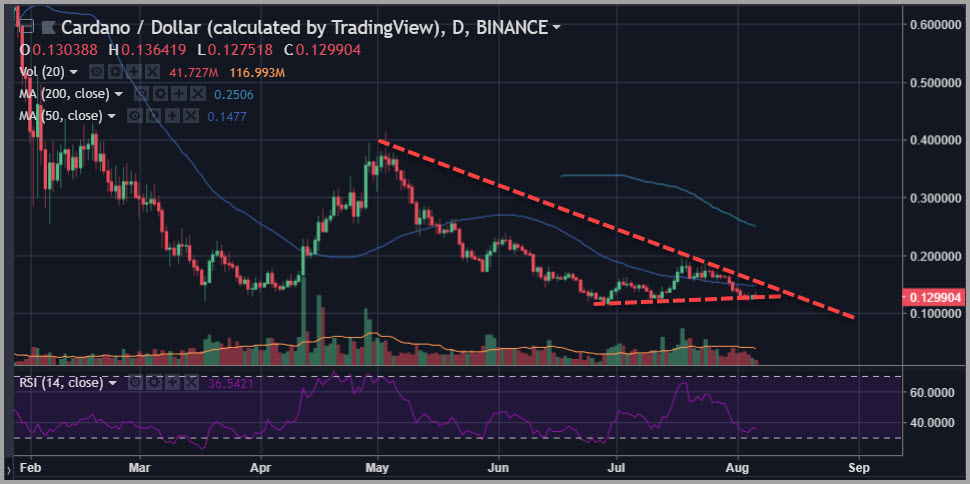
Chart courtesy of tradingview.com
Cardano (ADA) has pulled back to almost perfectly test support at its mid-July lows in the $0.12 area. This follows the pattern we have seen in many other large market cap coins over the last several days.
However, the bounce that we’ve seen over the past 12 hours in Cardano (ADA) has shown itself to be somewhat more powerful than we have seen in many other coins across the complex during that same period.
That suggests the possibility that we are nearer to some kind of selling exhaustion for Cardano (ADA). However, if we have any doubts, they are spawned by the fact that the hourly MACD indicator has already moved toward an overbought level on what has not been a dramatic bounce. We would far prefer to see the oscillators quiet at this point in the bounce.
That said, this doesn’t rule out the possibility that Cardano (ADA) could begin to show positive signs in terms of how it deals with these critical support levels.
Happy Trading~
For the latest cryptocurrency news, join our Telegram!
Disclaimer: This article should not be taken as, and is not intended to provide, investment advice. Global Coin Report and/or its affiliates, employees, writers, and subcontractors are cryptocurrency investors and from time to time may or may not have holdings in some of the coins or tokens they cover. Please conduct your own thorough research before investing in any cryptocurrency and read our full disclaimer.
Image courtesy of Pexels
Charts courtesy of tradingview.com