Blogs
XRP Bitcoin Cash (BCH) Price Analysis: Battles at Key Levels

Technical analysis is both a discipline and a process. As a discipline, there are a set of tools and rules that define an approach to analyzing a track record of the decision-making of a crowd of people. The goal is to extrapolate based on known patterns of human decision-making and the identification of where we are in those patterns in a particular market.
However, as a process, there are often incursions that can be seen as either a rejection of a current thesis or an opportunity falling within the context of a perspective. In this case, as we take a look at XRP and Bitcoin Cash (BCH), we will apply that discipline to see where the process may take us looking forward.
XRP
Price Analysis
- High: $0.45638
- Low: $0.45237
- Major Resistance Level: $0.50
- Hourly MACD: Short-term Oversold Buy Signal

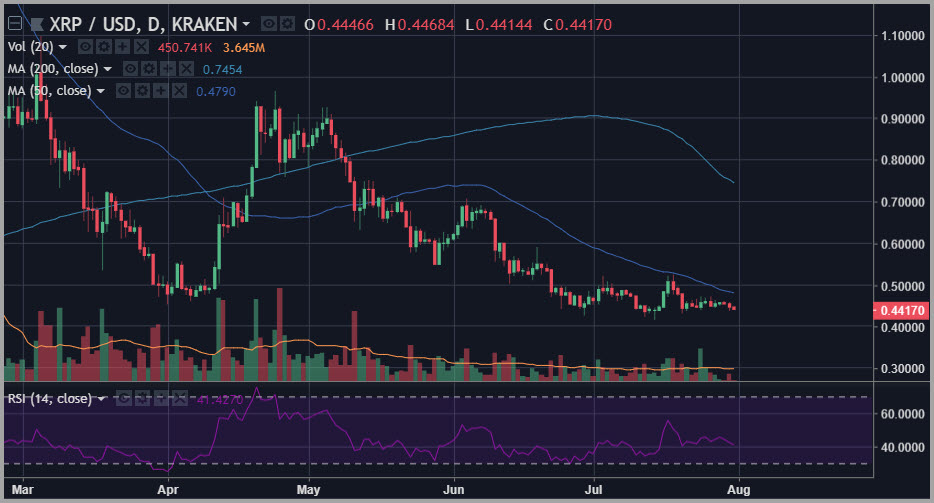
Chart courtesy of tradingview.com
When conducting analysis on the XRP chart, we continue to focus on the critical importance of the zone between $0.44 and $0.46, which defines the central axis of this coin’s recent consolidation pattern.
Over the past 48 hours, we have seen XRP break underneath the trendline on the hourly chart that defines the action for the past 10 days. Upon breaking underneath the $0.44 level, we saw some stops flush out, clearing things down to the $0.435 level. However, we also saw XRP quickly regain support and pop back up into the axis range noted above.
This is another good sign of strong-handed support that appears to be underpinning the coin at its current levels.
A continuous series of such examples have defined the action for XRP over recent months, always with support stepping in right in this area to save the day.
At some point, we will have witnessed a massive transference of stockpiles of this coin from sellers continually providing resistance to new buyers holding these levels of support. Eventually, we may be ready to explore the other side of this range and retest resistance at the $0.50 level.
Bitcoin Cash (BCH)
Price Analysis
- High: $828.22
- Low: $814.61
- Major Resistance Level: $900
- Hourly MACD: Histogram Bull Signal
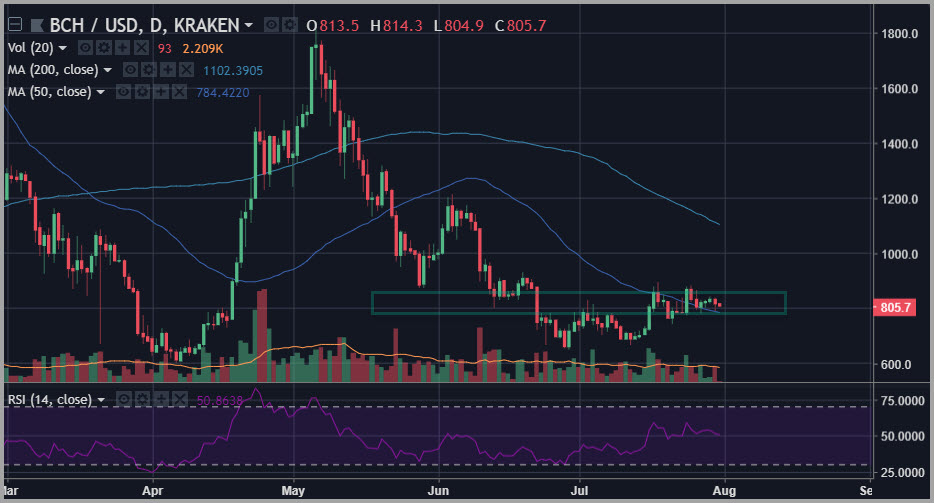
Chart courtesy of tradingview.com
Bitcoin Cash (BCH) continues to be one of the most interesting patterns setting up in the cryptocurrency complex – at least among the market cap leaderboard.
The pattern here of a series of higher lows and the possibility of an ascending breakout pattern with a bullish trigger at the $900 level is somewhat unmistakable at this point and continues to be reinforced in recent action.
The latest dip that we’ve seen over the last 24 hours across the complex is just another example, as support continues to step in for Bitcoin Cash (BCH) pinning it above the levels that we saw in place several weeks ago.
If this type of behavior continues, and we keep seeing positive signals in the tape, we would begin to look for a breakout above the $875 level over the near-term. And if this breakout comes on strong volume, look for a move to challenge levels above $900 soon after.
Happy Trading~
For the latest cryptocurrency news, join our Telegram!
Disclaimer: This article should not be taken as, and is not intended to provide, investment advice. Global Coin Report and/or its affiliates, employees, writers, and subcontractors are cryptocurrency investors and from time to time may or may not have holdings in some of the coins or tokens they cover. Please conduct your own thorough research before investing in any cryptocurrency and read our full disclaimer.
Image courtesy of Pexels
Charts courtesy of tradingview.com