
Bitcoin
Bitcoin (BTC) Ethereum (ETH) Price Analysis – Searching for Signals

The broad cryptocurrency landscape continues to trace out a major-degree corrective phase that was born into existence about two weeks before the end of the last calendar year. That makes this process now roughly 7 months old.
The crypto world moves at a fast pace relative to other markets, and 7 months is a lifetime, so traders and investors are doubtless hard on the search for tangible signals of a coming change in character in the charts.
With that in mind, we will take a few minutes and dive into the big-picture technical action for the two biggest heavyweights in the coin realm: Bitcoin (BTC) and Ethereum (ETH).
Bitcoin (BTC)
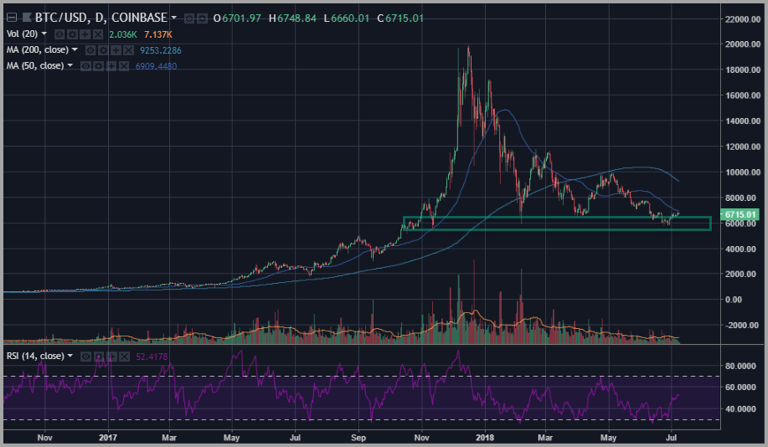
Chart courtesy of trading view.com
Naturally, for much of the general public, Bitcoin is somewhat synonymous with the cryptocurrency complex. In a sense, it functions as almost a major index or average – like the S&P 500. While this is far from true in any literal sense, the correlation framework that defines cryptocurrencies in general often reinforces this intuitive notion perhaps more than it should.
Hence, whether justified or not, in many important ways it is hard to get away from the sense that, as Bitcoin goes, so goes crypto.
As such, when we take a close look at the Bitcoin (BTC) chart, we are looking at the defining trend for the complex as a whole. And that trend is quite clearly “down”, and has been for the better part of the past eight months.
Without question, the key level to appreciate here is the $6000 level. In terms of closing prices, this level more or less held as key support back in early November of last year, before the most significant and maniacal portion of the Bitcoin bubble sprint higher from mid-November to mid-December.
This same level also played a significant part in defining the lows that Bitcoin reached in early February of this year. And, as fate would have it, this is just about the level at which we held that key support late last month.
It is not insignificant to note that the lows recorded in BTC in April 2017 – as a final check before the parabolic move higher began – were right around the $1000 level. If one establishes this level as the defining low point in a Fibonacci retracement ruler, then the $6000 level is also a near-perfect 78.6% Fib retracement of the entire bubble run.
However, perhaps the most important point is this: we recently saw a break underneath the March/April 2018 lows, followed by a test of the underside of the $6000 level, further followed by a grinding rally that has now lasted nearly two weeks. This rally has not been accompanied by any true game-changing positives for Bitcoin in terms of news or headline drivers.
This is a bit of a red flag for bears holding short interest in the BTC futures: a test of new lows that gives way to a sharp rally on no new bullish catalysts can often be a sign of a selling exhaustion point.
Hence, one may make a case that the BTC chart is beginning finally to carve out the ingredients of a base under construction. Stay tuned!
Ethereum (ETH)
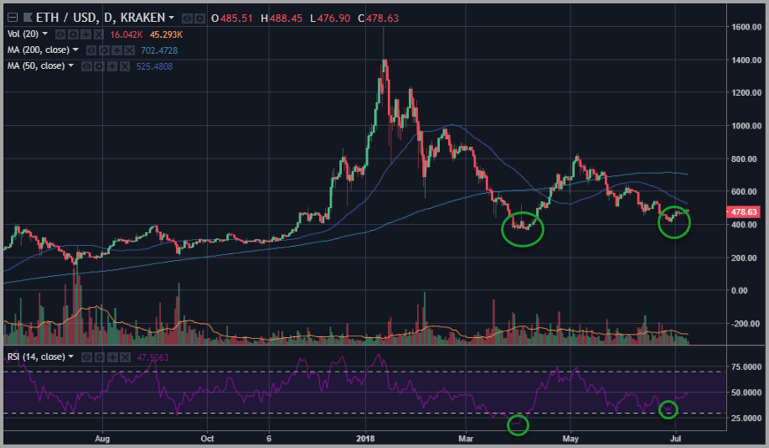
Chart courtesy of trading view.com
As one might expect, looking at the ETH chart is very similar to looking at the Bitcoin chart. The correlation between BTC and ETH has been quite high since midway through last year.
However, we have begun to see a bit of a divergence in recent action that suggests some favoritism toward ETH during the immediate future as compared to Bitcoin.
The divergence is built off the fact that, while Bitcoin broke beneath its March/April 2018 lows during June trade, ETH held above that same pivot point on its own chart, putting in sharp support at the very important $400 level.
At the same time, Ethereum (ETH) was able to carve out a pivot at an extreme oversold reading on the RSI chart, but a positive divergence relative to the same point on the RSI oscillator seen several months ago at the key pivot low.
While this may signal a potential for bullish action ahead in ETH, it is important that traders not get carried away with the small timeframe signals.
The fact still remains that, in the case of both of these coins, and in the larger case defining the crypto landscape in general, we are dealing with charts that are mostly still solidly underneath their major moving averages, with many of them moving underneath downward sloped averages.
In such a situation, the odds don’t favor aggressive long positioning until some level of further technical confirmation starts to rear its head on the charts.
Happy Trading!!
For the latest cryptocurrency news, join our Telegram!
Disclaimer: This article should not be taken as, and is not intended to provide, investment advice. Global Coin Report and/or its affiliates, employees, writers, and subcontractors are cryptocurrency investors and from time to time may or may not have holdings in some of the coins or tokens they cover. Please conduct your own thorough research before investing in any cryptocurrency and read our full disclaimer.
Image courtesy of Pexels
Charts courtesy of tradingview.com


Bitcoin price dumped hard on Monday, briefly slipping below $41,000, erasing gains recorded in the previous week. The premier cryptocurrency seems to have exhausted its recent rally propelled by industry vulnerabilities. At the time of writing, the world’s largest cryptocurrency was trading slightly lower at $41,385. Bitcoin’s total market cap has dipped by 2% over the past day, while the total volume of BTC tokens traded over the same period climbed by 58%.
Fundamentals
Bitcoin price has been facing retracements and a rollercoaster over the past few days after recently rocketing to a 20-month peak. On-chain data has suggested that many investors used the opportunity to take some profits, leading to a decline in the asset’s price.
Bitcoin’s price slump is mirrored in the wider crypto market, with the global crypto market cap decreasing by 1.85% over the past 24 hours to $1.55 trillion. The total crypto market volume has increased by 32% over the same period. The Crypto Fear and Greed Index has plunged from a level of extreme greed to a greed level of 70, suggesting a decline in risk appetite.
Ethereum, the largest altcoin by market capitalization, is currently trading at $2,167, down almost 3% for the day. Meme coins have been hit hard by the market slump, with Dogecoin and Shiba Inu down by more than 4% over the last day.
Last week on Thursday, cryptocurrency experts took notice of…

Bitcoin price edged lower on Thursday despite optimism in wider markets on the back of the Fed’s interest rate decision. The flagship cryptocurrency has been consolidating above the critical level of $42,000 after briefly topping $44,000, its highest level in 20 months. Bitcoin was trading 0.71% lower at $42,569 at press time. BTC’s total market cap has increased by more than 3% over the last day to $832 billion, while the total volume of the asset traded over the same period jumped by 22%.
Economic Outlook
Bitcoin price has been trading sideways over the past few days, suggesting a pause in its recent rally towards $45,000. The premier cryptocurrency has decreased by 4% in the past week but remains 15.22% higher in the month to date. The digital asset has staged a significant recovery this year after a torrid 2022 in which a string of scandals, including the collapse of FTX, led to a market meltdown, undermining the credibility of the sector.
The crypto market has been buoyed by the Fed’s latest interest rate decision. The US Federal Reserve on Wednesday held its key interest rate unchanged for the third consecutive time, in line with market expectations. With the easing of the inflation rate, members of the Federal Open Market Committee (FOMC) voted to keep the benchmark overnight borrowing rate in a targeted range between 5.25%-5.5%.
Additionally, the central bank indicated that three rate…

Bitcoin price has been hovering above the $43,000 psychological level over the past two days amid anticipation about the potential approval of a spot bitcoin ETF. The flagship cryptocurrency has climbed more than 16% in the past week and nearly 170% in the year to date. Bitcoin’s total market cap has increased by nearly 5% over the past 24 hours to $858.9 billion, while the total volume of the token traded rose by 43%. The Bitcoin price was trading at $43,914 at press time.
Fundamentals
Bitcoin price has posted significant gains over the past few days, climbing to its highest level since April 2022, before the crash of a stablecoin that started a litany of company failures, pummeling crypto prices. The world’s largest cryptocurrency briefly topped the crucial level of $44,000 on Wednesday amid rising momentum despite being massively overbought.
According to analysts, with no spot bitcoin ETF approvals yet and the halving event five to six months away, the market is riding on FOMO. Capital has been flowing in the Bitcoin market amid enthusiasm that the launches of spot ETF will bring in billions of dollars of new investment into the crypto sector.
Investors have already started providing capital as seed money for ETF products. Notably, a recent report by CoinDesk showed that the world’s largest fund manager, BlackRock, received $100,000 in capital from a seed investor for its spot bitcoin exchange-traded fund…


-
 Blogs7 years ago
Bitcoin Cash (BCH) and Ripple (XRP) Headed to Expansion with Revolut
-
 Blogs7 years ago
Another Bank Joins Ripple! The first ever bank in Oman to be a part of RippleNet
-
 Blogs7 years ago
Standard Chartered Plans on Extending the Use of Ripple (XRP) Network
-
 Blogs7 years ago
Electroneum (ETN) New Mining App Set For Mass Adoption
-
 Don't Miss7 years ago
Ripple’s five new partnerships are mouthwatering
-
 Blogs7 years ago
Cryptocurrency is paving new avenues for content creators to explore
-
 Blogs7 years ago
Ethereum Classic (ETC) Is Aiming To Align With Ethereum (ETH)
-
 Blogs7 years ago
Is Litecoin (LTC) Changing Its Game Plan By Going For Mass Adoption?


