
Bitcoin
Bitcoin (BTC) Ethereum (ETH) IOTA (IOT) Technical Analysis – Which Way Will The Wind Blow?

During the past several days, the overall cryptocurrency universe has found the footing ‘slippery’ and trading slightly lower across the board with indecision appearing to be the theme throughout with no real leadership stepping up to the forefront and leading the way. Thus, both investors/traders have been treated to a slightly lower tape awaiting further signs of clues/evidence with respect to direction.
As we’ve monitored the action or lack thereof, we can’t help wonder whether all eyes are peeled on BTC and its next directional move for clarity?
With that said, let’s revisit what we stated a few days ago (last week) when we profiled the technical posture of BTC and what we would need to see occur in order for a potential move in either direction.
“We’re once again in a similar position with BTC forming yet another potential inverted H&S pattern and we ask ourselves the same question today as we did just a couple of Months ago, “Are there far too many eyes (ourselves included) witnessing another replay of the same scene, albeit, just a different time?”
We also noted, “If at any time moving forward, BTC can clear the 9768; 9900 and perhaps more importantly, the 10,112 level/s and capable of holding such figures, the probability for a positive outcome for the developing pattern will certainly provide clues/evidence that the second go-around may just be a success.”
As we can observe from the daily chart below, BTC did indeed go ‘top-side’ of both the 9768 as well as the 9900 levels, however, was unable to breach the noted 10,112 level (thus far) and was stymied at the 200DMA.
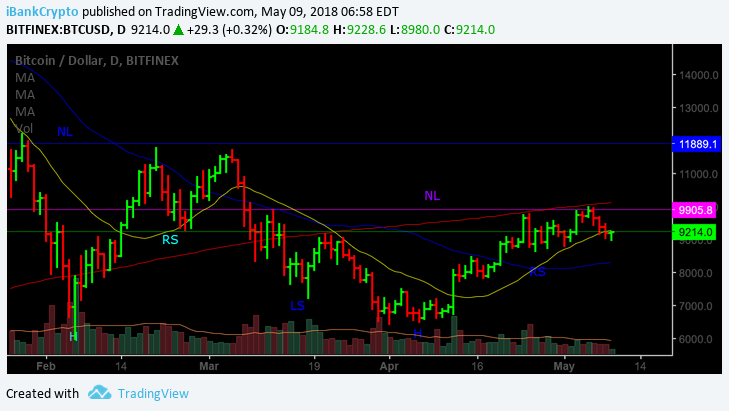
Thus, has the recent attempt of a successful completion out of the inverted H&S pattern resulted in failure yet again?
While some may be of the thought that the answer to such question is in the affirmative, we digress and continue to believe that it’s a bit premature in declaring the recent move a failure, just yet.
Therefore, while our noted top-side levels (9768; 9900 & 10,112) remain hurdles to be cleared, patience is in order as we await the verdict and allow additional time for the pattern to play itself out either favorably or, witness yet another disappointment from a short-term perspective.
While BTC continues in its pattern awaiting resolution, Ethereum (ETH) presently finds itself in a far better technical posture as we can observe below:
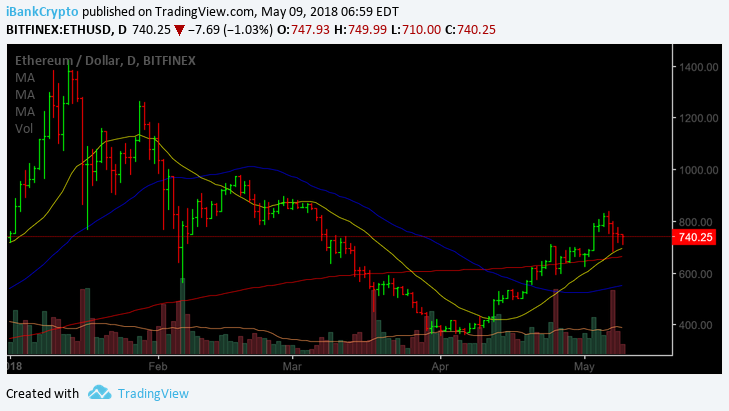
Observing the daily chart above, we can see that ETH is trading above its 20/50 and 200DMA’s respectively, which is indicative of a favorable technical posture.
We can also observe that the 20DMA (yellow line) has crossed up through the 200DMA (red line), while the 50DMA (blue line) is starting to turn upwards, all positive developments from a relative strength standpoint.
Thus, moving forward, both investors traders may want to continue to monitor the action in ETH utilizing the 663 (200DMA) level as potential short-term support, while the 838 as well as the 895-905 zone providing potential headwinds/resistance.
Finally, last week we brought readers attention to IOTA (IOT), where we believed that the action required your attention and eyes as a potential move was imminent, which can be viewed here https://globalcoinreport.com/iota-iot-requires-close-attention-and-eyes/
We noted that, “if at any point in the days ahead IOT can go top-side of the $2.24 figure and ‘stick’, the potential for a move up and into the $2.65 level becomes a viable possibility and if things really heat-up, the next level hanging out there is located at $3.20, while the $1.85 level (20- DMA) acting as both your guide as well as potential short-term support.”
As we can observe below, IOT did indeed go ‘top-side’ of the 2.24 level and went directly passed “Go” and into our 2.65 noted price objective for a rapid 30% move printing a day high of 2.69.
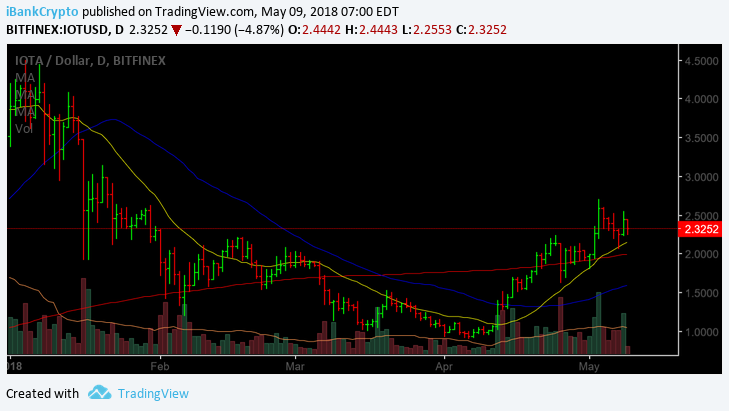
With that said, the action in IOT remains extremely favorable from a technical viewpoint and both investors/traders may want to continue to monitor the action in IOT moving forward as we suspect that the 3.20 level may come into ‘play’ in the not too distant future.
Summing it all up, we await resolution of the BTC pattern development and to which way the wind will blow, while both ETH and IOT continue to suggest a favorable technical outlook.
Happy Trading!!
For the latest cryptocurrency news, join our Telegram!
Disclaimer: This article should not be taken as, and is not intended to provide, investment advice. Global Coin Report and/or its affiliates, employees, writers, and subcontractors are cryptocurrency investors and from time to time may or may not have holdings in some of the coins or tokens they cover. Please conduct your own thorough research before investing in any cryptocurrency and read our full disclaimer.
Image courtesy of Pexels
Chart courtesy of tradingview.com


Bitcoin price dumped hard on Monday, briefly slipping below $41,000, erasing gains recorded in the previous week. The premier cryptocurrency seems to have exhausted its recent rally propelled by industry vulnerabilities. At the time of writing, the world’s largest cryptocurrency was trading slightly lower at $41,385. Bitcoin’s total market cap has dipped by 2% over the past day, while the total volume of BTC tokens traded over the same period climbed by 58%.
Fundamentals
Bitcoin price has been facing retracements and a rollercoaster over the past few days after recently rocketing to a 20-month peak. On-chain data has suggested that many investors used the opportunity to take some profits, leading to a decline in the asset’s price.
Bitcoin’s price slump is mirrored in the wider crypto market, with the global crypto market cap decreasing by 1.85% over the past 24 hours to $1.55 trillion. The total crypto market volume has increased by 32% over the same period. The Crypto Fear and Greed Index has plunged from a level of extreme greed to a greed level of 70, suggesting a decline in risk appetite.
Ethereum, the largest altcoin by market capitalization, is currently trading at $2,167, down almost 3% for the day. Meme coins have been hit hard by the market slump, with Dogecoin and Shiba Inu down by more than 4% over the last day.
Last week on Thursday, cryptocurrency experts took notice of…

Bitcoin price edged lower on Thursday despite optimism in wider markets on the back of the Fed’s interest rate decision. The flagship cryptocurrency has been consolidating above the critical level of $42,000 after briefly topping $44,000, its highest level in 20 months. Bitcoin was trading 0.71% lower at $42,569 at press time. BTC’s total market cap has increased by more than 3% over the last day to $832 billion, while the total volume of the asset traded over the same period jumped by 22%.
Economic Outlook
Bitcoin price has been trading sideways over the past few days, suggesting a pause in its recent rally towards $45,000. The premier cryptocurrency has decreased by 4% in the past week but remains 15.22% higher in the month to date. The digital asset has staged a significant recovery this year after a torrid 2022 in which a string of scandals, including the collapse of FTX, led to a market meltdown, undermining the credibility of the sector.
The crypto market has been buoyed by the Fed’s latest interest rate decision. The US Federal Reserve on Wednesday held its key interest rate unchanged for the third consecutive time, in line with market expectations. With the easing of the inflation rate, members of the Federal Open Market Committee (FOMC) voted to keep the benchmark overnight borrowing rate in a targeted range between 5.25%-5.5%.
Additionally, the central bank indicated that three rate…

Bitcoin price has been hovering above the $43,000 psychological level over the past two days amid anticipation about the potential approval of a spot bitcoin ETF. The flagship cryptocurrency has climbed more than 16% in the past week and nearly 170% in the year to date. Bitcoin’s total market cap has increased by nearly 5% over the past 24 hours to $858.9 billion, while the total volume of the token traded rose by 43%. The Bitcoin price was trading at $43,914 at press time.
Fundamentals
Bitcoin price has posted significant gains over the past few days, climbing to its highest level since April 2022, before the crash of a stablecoin that started a litany of company failures, pummeling crypto prices. The world’s largest cryptocurrency briefly topped the crucial level of $44,000 on Wednesday amid rising momentum despite being massively overbought.
According to analysts, with no spot bitcoin ETF approvals yet and the halving event five to six months away, the market is riding on FOMO. Capital has been flowing in the Bitcoin market amid enthusiasm that the launches of spot ETF will bring in billions of dollars of new investment into the crypto sector.
Investors have already started providing capital as seed money for ETF products. Notably, a recent report by CoinDesk showed that the world’s largest fund manager, BlackRock, received $100,000 in capital from a seed investor for its spot bitcoin exchange-traded fund…


-
 Blogs6 years ago
Bitcoin Cash (BCH) and Ripple (XRP) Headed to Expansion with Revolut
-
 Blogs6 years ago
Another Bank Joins Ripple! The first ever bank in Oman to be a part of RippleNet
-
 Blogs6 years ago
Standard Chartered Plans on Extending the Use of Ripple (XRP) Network
-
 Blogs6 years ago
Electroneum (ETN) New Mining App Set For Mass Adoption
-
 Don't Miss6 years ago
Ripple’s five new partnerships are mouthwatering
-
 Blogs6 years ago
Ethereum Classic (ETC) Is Aiming To Align With Ethereum (ETH)
-
 Blogs6 years ago
Cryptocurrency is paving new avenues for content creators to explore
-
 Blogs6 years ago
Litecoin (LTC) Becomes Compatible with Blocknet while Getting Listed on Gemini Exchange


