
Bitcoin
Bitcoin (BTC) Technical Analysis – 2nd Time A Charm?

Back in 1Q18 in the January-through-March period, all eyes (including yours truly) were focused on the developing inverted Head-and-Shoulders (H&S) pattern forming with Bitcoin (BTC).
While reminiscing back in time, we couldn’t help wondering at that time, whether there were far too many eyes looking at and anticipating a break into higher ground out of the developing inverted H&S pattern. As the pattern played out, the end result was a failure and down the slippery slope did BTC find itself before ultimately bottoming-out at the 6.4K level.
Well, as it turns out, we’re once again in a similar position with BTC forming yet another potential inverted H&S pattern and we ask ourselves the same question today as we did just a couple of Months ago, “Are there far too many eyes (ourselves included) witnessing another replay of the same scene, albeit, just a different time?”
With that said, let’s take a look at the technical picture and try to determine whether this time around is any different and whether both investors/traders may be treated to a better result.
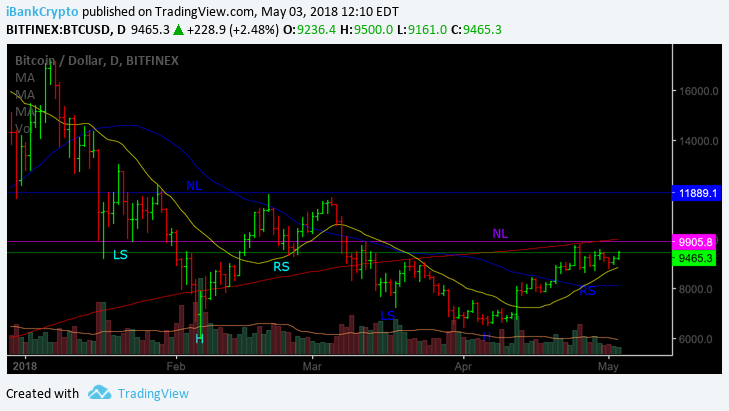
As we can see from the daily chart above, BTC was forming the noted inverted H&S pattern back in 1Q18. We can also witness that the pattern failed at the Neckline via the dark blue line despite BTC trading above all of its important moving averages (20/50/200DMA’s) and subsequently, was treated to a rather harsh sell-off down to the 6.4K level.
Fast forward to today, and here we are once again with BTC forming yet another inverted H&S pattern below its 200DMA yet, trading above both its 20 and 50DMA’s with the Neckline offered via the purple horizontal line.
Thus, are we setting up for yet another disappointment or, will the second time around be a charm for BTC?
While it’s far too premature to declare, moving forward, both investors/traders may want to focus their attention on the following levels for further evidence and clues.
If at any time moving forward, BTC can clear the 9768; 9900 and perhaps more importantly, the 10,112 level/s and capable of holding such figures, the probability for a positive outcome for the developing pattern will certainly provide clues/evidence that the second go-around may just be a success.
If, on the other hand, BTC is unable to clear the 10,112 level and hold, or, perhaps more importantly, witness upside ‘Follow-Through’, BTC may just find itself on the receiving end of a similar result as we witnessed back in 1Q18.
Nevertheless, the inverted H&S continues to develop. We await the verdict. While it was six times – 6X a charm for Vinny in the film “My Cousin Vinny”, perhaps BTC will fair better in its second attempt at delivering the goods, producing a happy ending.
Happy Trading!
For the latest cryptocurrency news, join our Telegram!
Disclaimer: This article should not be taken as, and is not intended to provide, investment advice. Global Coin Report and/or its affiliates, employees, writers, and subcontractors are cryptocurrency investors and from time to time may or may not have holdings in some of the coins or tokens they cover. Please conduct your own thorough research before investing in any cryptocurrency and read our full disclaimer.
Image courtesy of Matt Wolynski via Flickr
Chart courtesy of tradingview.com


Bitcoin price dumped hard on Monday, briefly slipping below $41,000, erasing gains recorded in the previous week. The premier cryptocurrency seems to have exhausted its recent rally propelled by industry vulnerabilities. At the time of writing, the world’s largest cryptocurrency was trading slightly lower at $41,385. Bitcoin’s total market cap has dipped by 2% over the past day, while the total volume of BTC tokens traded over the same period climbed by 58%.
Fundamentals
Bitcoin price has been facing retracements and a rollercoaster over the past few days after recently rocketing to a 20-month peak. On-chain data has suggested that many investors used the opportunity to take some profits, leading to a decline in the asset’s price.
Bitcoin’s price slump is mirrored in the wider crypto market, with the global crypto market cap decreasing by 1.85% over the past 24 hours to $1.55 trillion. The total crypto market volume has increased by 32% over the same period. The Crypto Fear and Greed Index has plunged from a level of extreme greed to a greed level of 70, suggesting a decline in risk appetite.
Ethereum, the largest altcoin by market capitalization, is currently trading at $2,167, down almost 3% for the day. Meme coins have been hit hard by the market slump, with Dogecoin and Shiba Inu down by more than 4% over the last day.
Last week on Thursday, cryptocurrency experts took notice of…

Bitcoin price edged lower on Thursday despite optimism in wider markets on the back of the Fed’s interest rate decision. The flagship cryptocurrency has been consolidating above the critical level of $42,000 after briefly topping $44,000, its highest level in 20 months. Bitcoin was trading 0.71% lower at $42,569 at press time. BTC’s total market cap has increased by more than 3% over the last day to $832 billion, while the total volume of the asset traded over the same period jumped by 22%.
Economic Outlook
Bitcoin price has been trading sideways over the past few days, suggesting a pause in its recent rally towards $45,000. The premier cryptocurrency has decreased by 4% in the past week but remains 15.22% higher in the month to date. The digital asset has staged a significant recovery this year after a torrid 2022 in which a string of scandals, including the collapse of FTX, led to a market meltdown, undermining the credibility of the sector.
The crypto market has been buoyed by the Fed’s latest interest rate decision. The US Federal Reserve on Wednesday held its key interest rate unchanged for the third consecutive time, in line with market expectations. With the easing of the inflation rate, members of the Federal Open Market Committee (FOMC) voted to keep the benchmark overnight borrowing rate in a targeted range between 5.25%-5.5%.
Additionally, the central bank indicated that three rate…
Bitcoin price has been hovering above the $43,000 psychological level over the past two days amid anticipation about the potential approval of a spot bitcoin ETF. The flagship cryptocurrency has climbed more than 16% in the past week and nearly 170% in the year to date. Bitcoin’s total market cap has increased by nearly 5% over the past 24 hours to $858.9 billion, while the total volume of the token traded rose by 43%. The Bitcoin price was trading at $43,914 at press time.
Fundamentals
Bitcoin price has posted significant gains over the past few days, climbing to its highest level since April 2022, before the crash of a stablecoin that started a litany of company failures, pummeling crypto prices. The world’s largest cryptocurrency briefly topped the crucial level of $44,000 on Wednesday amid rising momentum despite being massively overbought.
According to analysts, with no spot bitcoin ETF approvals yet and the halving event five to six months away, the market is riding on FOMO. Capital has been flowing in the Bitcoin market amid enthusiasm that the launches of spot ETF will bring in billions of dollars of new investment into the crypto sector.
Investors have already started providing capital as seed money for ETF products. Notably, a recent report by CoinDesk showed that the world’s largest fund manager, BlackRock, received $100,000 in capital from a seed investor for its spot bitcoin exchange-traded fund…


-
 Blogs7 years ago
Bitcoin Cash (BCH) and Ripple (XRP) Headed to Expansion with Revolut
-
 Blogs7 years ago
Another Bank Joins Ripple! The first ever bank in Oman to be a part of RippleNet
-
 Blogs7 years ago
Standard Chartered Plans on Extending the Use of Ripple (XRP) Network
-
 Blogs7 years ago
Electroneum (ETN) New Mining App Set For Mass Adoption
-
 Don't Miss7 years ago
Ripple’s five new partnerships are mouthwatering
-
 Blogs7 years ago
Cryptocurrency is paving new avenues for content creators to explore
-
 Blogs7 years ago
Ethereum Classic (ETC) Is Aiming To Align With Ethereum (ETH)
-
 Blogs7 years ago
Is Litecoin (LTC) Changing Its Game Plan By Going For Mass Adoption?


